
Blue is the band growers reach for when a crop looks stretched, pale or slow to open its stomata, and it is the band most often over-ordered. The confusion comes from treating 400–500 nm as one ingredient with one dose. Inside that window sit at least three photoreceptor systems that read different wavebands, respond on different timescales and saturate at very different photon fluxes.
This article treats 400–500 nm as a control channel rather than a production channel: the receptor biology, the dose-response evidence for where blue stops paying for itself, and the arithmetic that makes blue photons more expensive than red ones. Quantitative statements carry a stated condition, because most blue-light claims describe one species, one background spectrum and one daily light integral.

Why 400–500 nm Is a Control Band, Not a Yield Band
Photosynthesis is broad: a 450 nm photon and a 660 nm photon both drive electron transport, and in a leaf with a normal pigment complement the quantum-yield difference is modest. Signalling is narrow. Blue-absorbing photoreceptors have absorption peaks tens of nanometres wide and dose-response curves that flatten early. National Library of Medicine describes blue light as acting through dedicated sensory pathways that regulate stomatal opening alongside photosynthesis, with the blue requirement for that response far below the flux needed for carbon assimilation.
That asymmetry defines a control band. Blue tells the plant where it is and whether to open its pores; red supplies the energy budget. Adding blue in expectation of a proportional yield gain applies a signal as if it were a resource, and the usual result is a shorter, thicker plant at some cost in biomass. Control bands are judged by whether the response occurred, not by how much of the band is present.
Three Receptors, Three Timescales: Cryptochrome, Phototropin, Zeaxanthin
Cryptochromes absorb in the blue with activity extending into UV-A. They are the photomorphogenic receptors: de-etiolation, suppression of hypocotyl and internode extension, circadian entrainment and, in several species, flowering time. Their responses are transcriptional and therefore slow — hours to days.
Phototropins are fast and directional: phototropism, chloroplast movement and the blue-light activation of the guard-cell proton pump behind stomatal opening. National Library of Medicine sets out the chain in which blue light activates a plasma-membrane H⁺-ATPase, hyperpolarises the membrane and drives the ion fluxes that raise guard-cell turgor — a minutes-scale pathway that changes a room’s humidity load the moment the lights come on.
Zeaxanthin sits between photoprotection and blue sensing. It accumulates under high light, dissipates excess excitation and takes part in blue-light-dependent stomatal signalling, so the same flux can produce different responses depending on the leaf’s recent light history.
The Blue Dose-Response Curve: Where It Saturates and Why 5–10 µmol·m⁻²·s⁻¹ Matters
The most useful number in this band is a saturation threshold, not a target. For stomatal opening, National Library of Medicine reports saturation at roughly 5–10 µmol·m⁻²·s⁻¹ of blue photon flux density, measured as the blue channel against a red background. Two conditions are embedded there: blue is counted on its own rather than as a share of total PPFD, and a red background is required for the response to be expressed.
Put it beside a normal setpoint. A vegetative room at 400 µmol·m⁻²·s⁻¹ with 10 percent blue delivers about 40 µmol·m⁻²·s⁻¹ of blue, four to eight times saturation; a propagation room at 120 at the same percentage delivers about 12, just above it. The same percentage produces very different absolute doses, which is why a percentage alone is an incomplete specification.
Above saturation the curve is not flat for every response. Morphology keeps responding and can reverse: more blue tends to reduce leaf area and increase leaf thickness, with the turning point depending on species and total DLI. The first 5–10 µmol·m⁻²·s⁻¹ buys the stomatal response, roughly 15–20 percent of PPFD buys architectural control, and beyond that require a measured crop response.
Morphology: Internode Length, Leaf Thickness and the Compactness Trade-off
Blue is the reliable answer to a stretched crop. Cryptochrome signalling suppresses extension, so raising the blue fraction shortens internodes, reduces petiole elongation and produces a denser canopy — often worth more in a transplant operation than the biomass it costs, since a compact plug ships better and establishes faster.
The cost is real. National Library of Medicine documents blue dose-response effects on leaf photosynthesis and morphology, including shifts in leaf thickness and specific leaf weight, with direction and magnitude depending on the blue fraction of total PAR and on the total daily dose. Leaves under a higher blue share are often thicker and smaller in area, while plants under very low blue can build more leaf area and fresh weight at the price of weaker structure.
The decision is about which failure mode is expensive: a crop that stretches loses money in labour and uniformity, a compact but lighter crop loses money at scale. Morphology also responds to the blue fraction across the photoperiod, and it interacts with temperature and the red:far-red ratio.
Stomatal Opening: Faster Gas Exchange, Higher Transpiration, Tighter VPD Control
Blue-driven stomatal opening runs on a minutes timescale, which in a closed room shortens the lag before carbon gain and reduces the period in which a leaf is warm, lit and unable to transpire.
The consequence is water. An open stoma is a hole in the leaf’s humidity boundary, and transpiration rises roughly with stomatal conductance at a given vapour pressure deficit. In a sealed room that water becomes latent load: every kilogram transpired carries about 2,450 kJ at 20 °C, or roughly 0.68 kWh of theoretical removal work at a coefficient of performance of 1, and more in practice. A blue-heavy recipe that holds stomata open through the photoperiod raises dehumidification demand even when air temperature looks stable.
That coupling is why blue share and VPD strategy belong in one decision: in a room near its dehumidification limit, adding blue to fix stretch can push humidity control past its capacity at lights-on. Establish latent capacity first, then set the blue fraction the room can actually support.
Secondary Metabolism: Why Blue Is Not UV — Different Dose Metric, Different Outcome
Blue and UV-A are often read as one stress axis, so more of either should mean more secondary metabolites. The receptor biology says otherwise: UV-A at 315–400 nm is read principally by UVR8, whose activation is a stress-adjacent signalling event, while blue at 400–500 nm is read by cryptochromes and phototropins, which regulate development and gas exchange under what is, for a plant, ordinary daylight.
The dose metric differs too. UV treatments are described as cumulative radiant exposure in kJ·m⁻² integrated over a treatment period, because the response depends on total energy delivered and on repair capacity between exposures. Blue is described as photon flux density in µmol·m⁻²·s⁻¹ and as a share of PPFD, because the response saturates at a flux and is largely independent of how long you sit above it. Applying a UV model to blue — doubling hours at half the flux to hold “dose” constant — describes a response the blue receptors do not have.
What blue contributes to quality is real but indirect. National Library of Medicine reviews the 400–500 nm region as participating in photosynthesis, photomorphogenesis and nutritional quality across crops, without arriving at a single recommended share, and the effect is mediated by canopy architecture and by anthocyanin responses to cryptochrome signalling in some species. Treat UV as an exposure you schedule and blue as a ratio you hold.
Photon Economics: Blue Costs More Joules per Photon Than Red
Every photon between 400 and 700 nm does roughly the same photosynthetic work per photon, which is why efficiency is quoted in µmol/J. But photons of different wavelengths cost different amounts of energy to make. One mole of photons carries about 119,627/λ kJ for λ in nanometres, so a mole of 450 nm photons carries roughly 266 kJ against roughly 181 kJ at 660 nm.
At equal diode quantum efficiency a micromole of blue takes about 1.47 times the energy of a micromole of deep red — roughly 3.7–3.8 µmol/J at 450 nm against 5.4–5.5 µmol/J at 660 nm with typical wall-plug conversion applied to both. This is an arithmetic conversion from photon energy, not a measurement of any luminaire, and it excludes package and driver losses.
A spectrum with a larger blue share therefore delivers fewer photons per kilowatt-hour. The penalty is small at production shares — moving from 5 to 15 percent blue changes blended photon cost by a few percent — and material only in blue-dominated spectra. The economics favour a small, precisely controlled dose: hold blue near saturation, scale red with the DLI target.
Blue Share by Crop Stage: Propagation, Vegetative, Flowering, Tissue Culture
The ranges below are working conventions used in fixture specification, not universal optima; they shift with species, cultivar, photoperiod and total DLI.
In propagation, blue is usually held at the higher end of the common 5–20 percent band, for compaction and prompt stomatal function; total PPFD is low there, so the absolute blue flux stays modest, and above roughly a fifth expect leaf-area suppression and slower rooting. In vegetative growth the share settles mid-band, with most incremental photons better spent in red, and a two-channel fixture lets blue be trimmed as the canopy closes. In flowering and fruiting, blue moves to the low end, where assimilate supply and canopy structure dominate, with a small blue floor preserving stomatal responsiveness and colour. In tissue culture the picture inverts — very low light, sealed vessels, and problems of hyperhydricity, rooting and abnormal stomatal function after transfer — so blue is used for morphogenesis at fluxes small enough that photon cost barely matters.
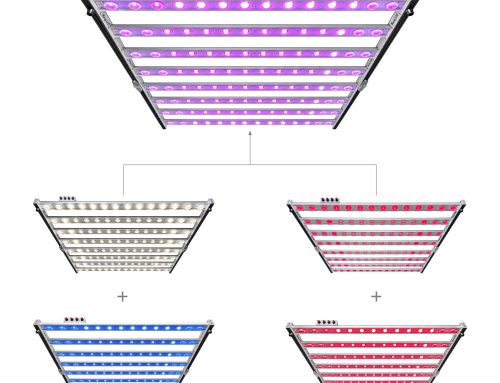
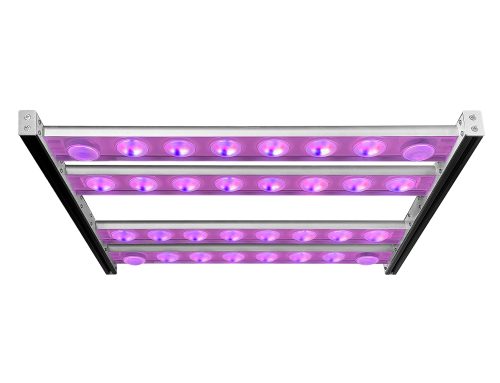
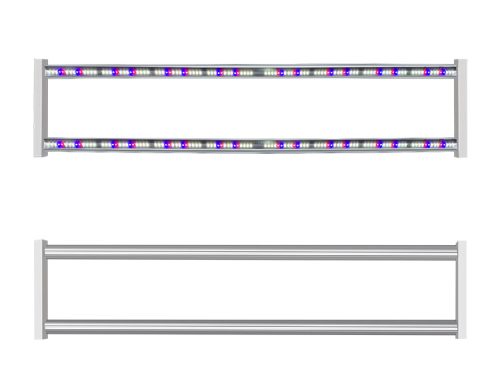
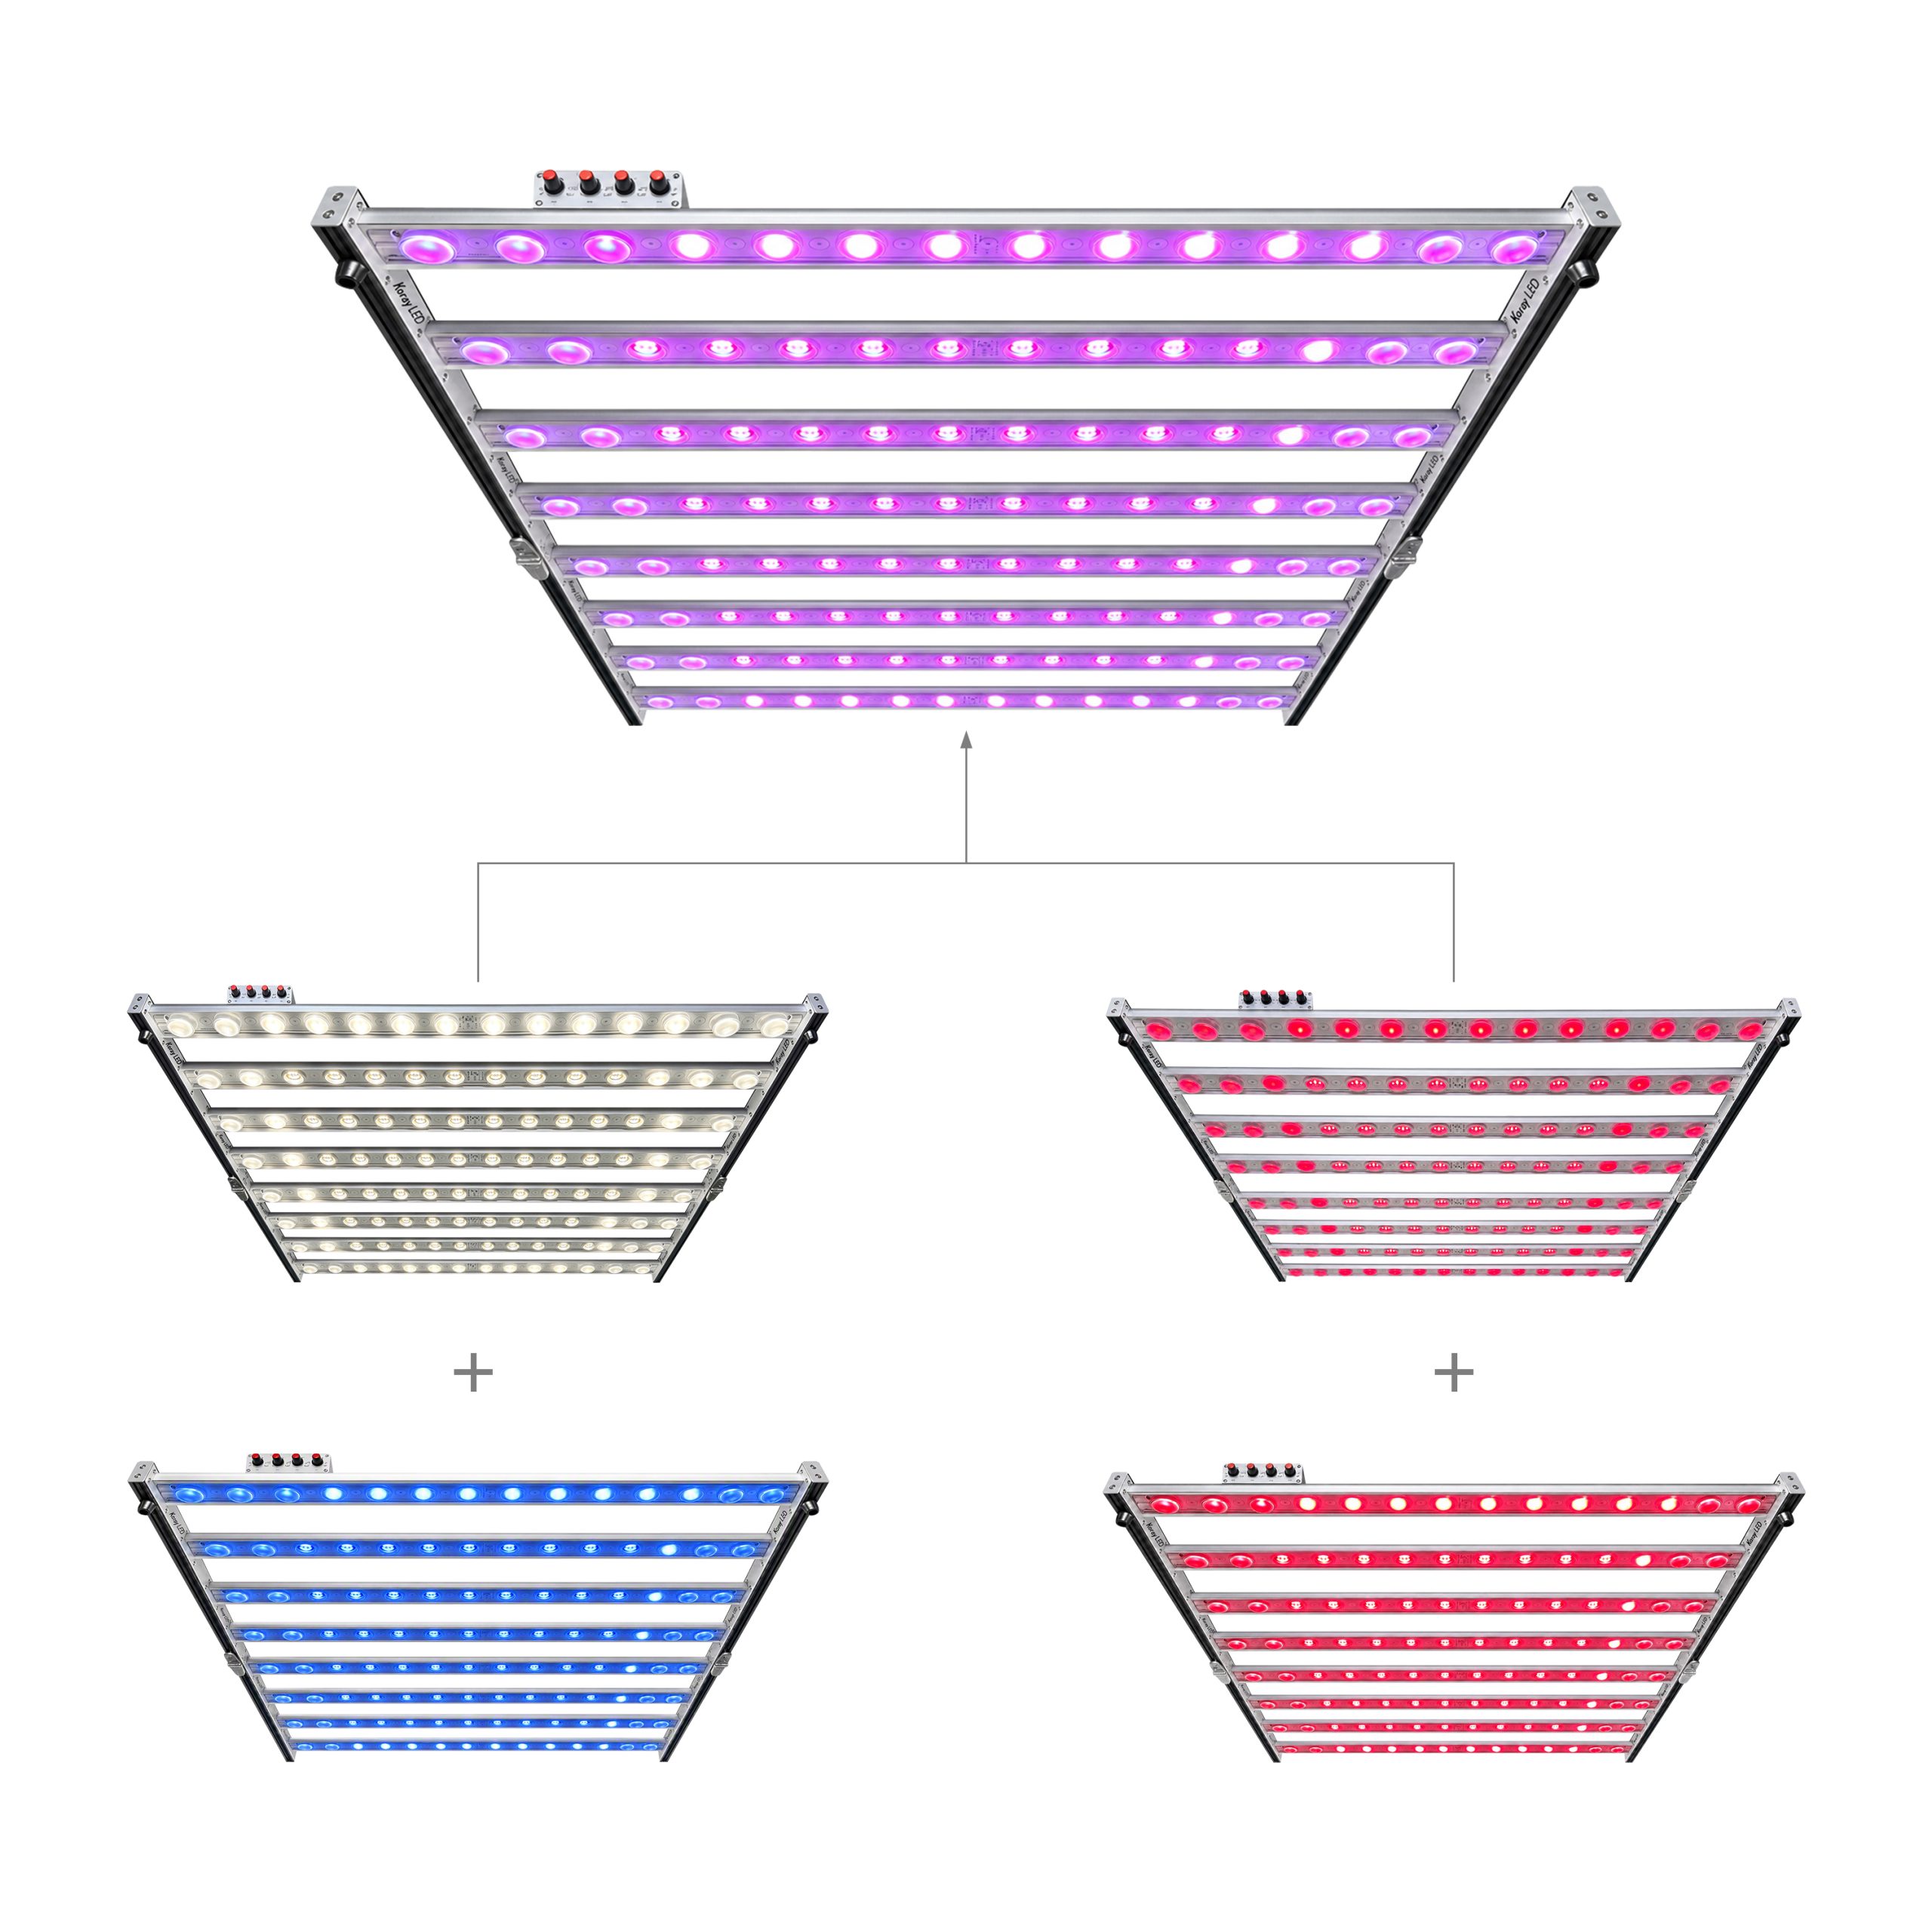
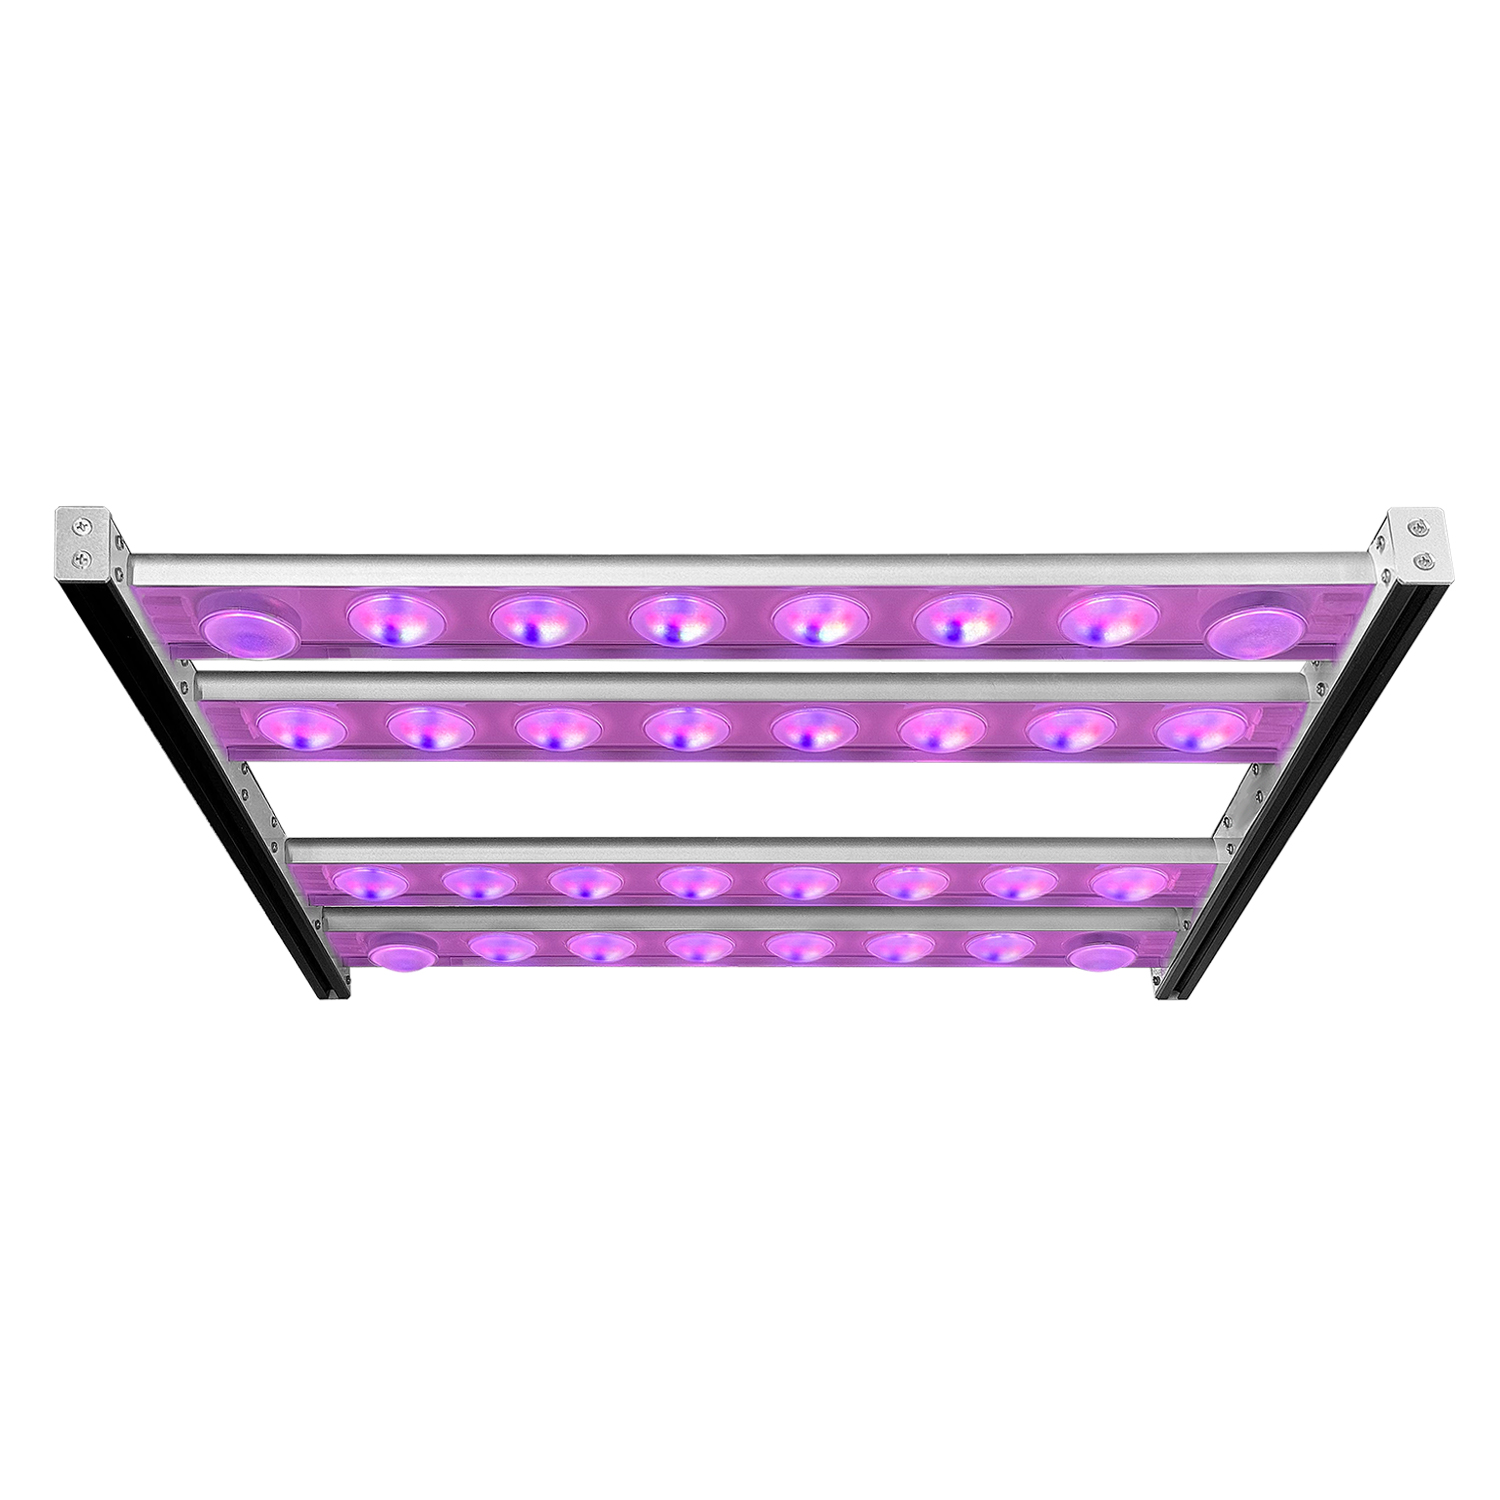
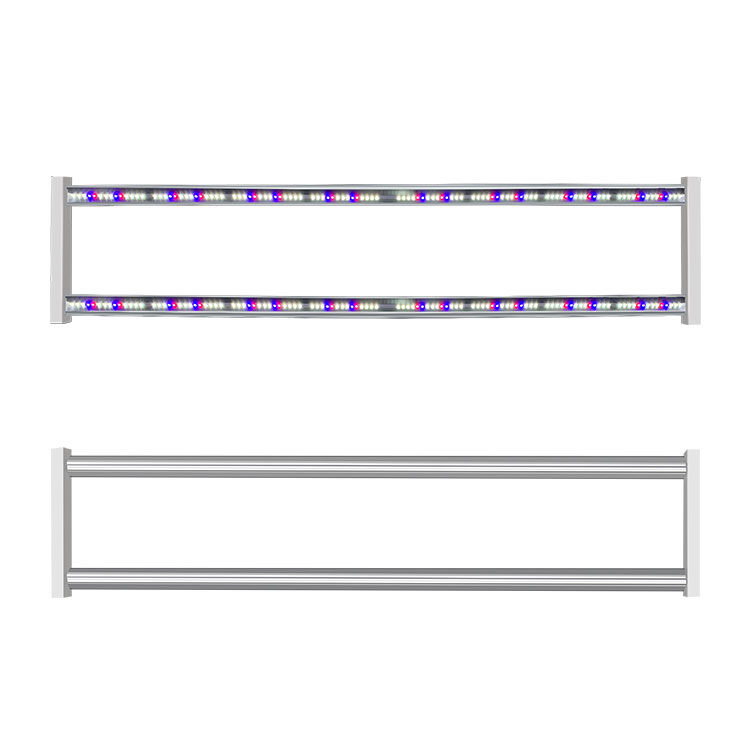
For rooms that mix stages under one electrical design, specify fixtures whose spectrum splits by channel, and size electrical and dehumidification capacity for the highest-blue stage that will ever run. Manufacturers such as Zhongshan Koray Opto-Electronic Co., Ltd., which has been building LED horticultural lighting since 2008, publish spectrum-designated options for that reason — the F108 vegetative and flowering spectrum on the RX-G4000H high-uniformity module, for example, and the two-channel 5000 K plus 660 nm layout on the RX-G80-2H board — documented on their official product pages and in the company profile.
Commissioning Checklist: Measuring Blue PPFD Separately and Verifying B:R Ratio
Most quantum sensors report total PPFD across 400–700 nm and cannot say how much of it is blue, so a room can pass a total-PPFD check while sitting outside its intended ratio.
1. Measure total PPFD at canopy height on a fixed grid, sensor levelled, recording mounting height and dimming level at the same time. 2. Measure the blue channel separately; subtracting a red reading from a total folds green and far-red error into the result. 3. Convert to a ratio at every grid point; clustered blue emitters produce uneven ratios. 4. Check the ratio at the dimming levels actually used: one driver holds it as you dim, separate channels change it. 5. Log blue flux in absolute units — a 12 percent share is 12 µmol·m⁻²·s⁻¹ at 100 total and 72 at 600 — and re-measure after any change to height, diffuser or canopy.
Five Bands, Five Dose Metrics: A Comparison Table
Blue arguments go in circles because each band is quantified with a different unit. The table puts five bands beside the metric that governs the response in each, so a value from one row is not carried into another.
| Band | Primary receptor | Dose metric | Saturation or useful range (stated condition) | Primary grower lever |
|---|---|---|---|---|
| Blue 400–500 nm (this article) | Cryptochrome, phototropin, zeaxanthin | Blue-channel PPFD, µmol·m⁻²·s⁻¹, on a red background | Stomatal opening saturates at ≈5–10 µmol·m⁻²·s⁻¹ of blue; architecture responds up to roughly 5–20% of total PPFD | Split blue and red channels; hold blue flux, scale red with DLI |
| Green 500–600 nm | No dedicated photoreceptor; weak chlorophyll absorption | Transmitted fraction through leaf and canopy, % | A penetration property, not a flux threshold; depends on leaf thickness and canopy density | Canopy management and fixture geometry rather than green share |
| Red 600–700 nm | Phytochromes (Pfr/Pr), chlorophyll | PPFD and DLI, mol·m⁻²·d⁻¹ | No low-flux saturation; scales with the daily integral until photoinhibition or sink limits | Total output and photoperiod — the main energy lever |
| Far-red 700–750 nm | Phytochrome Pfr and dark reversion | Phytochrome photostationary state and R:FR ratio | Ratio-based, not absolute; depends on the phytochrome state set by the rest of the spectrum | End-of-day or ratio control, not bulk wattage |
| UV-A 315–400 nm | UVR8 | Cumulative radiant exposure, kJ·m⁻² over the treatment period | Threshold plus repair-dependent, so rate and duration are not interchangeable | Scheduled exposures with a UV channel and a UV meter |
Read across the dose-metric column and the argument settles: blue is a flux, far-red is a ratio, UV-A is an accumulated exposure, red is a daily integral, green is a transmission property. Converting one into another without saying so produces numbers that are not comparable, however precise they look.

The short version. Treat 400–500 nm as a control signal with a low saturation point. Measure the blue channel in absolute µmol·m⁻²·s⁻¹, hold it near or just above 5–10 where the goals are stomatal and architectural, and set the share of total PPFD from the crop stage. Blue photons cost more joules each, opening stomata moves water into the latent load, and blue is not a substitute for UV in any quality claim. Where a spectrum splits by channel, blue dose becomes a value an operator can hold constant while production scales around it.
Frequently asked questions
Does more blue always make plants more compact?
No. Compactness improves with blue share up to a point and then stops paying: internode suppression saturates while leaf area and fresh weight keep falling. Past roughly a fifth of total PPFD, most crops show a compact plant with less biomass rather than a better one, so the useful question is which failure mode costs more.
If stomatal opening saturates at 5–10 µmol·m⁻²·s⁻¹, can blue be ignored above that?
No. That threshold covers one fast response against a red background and says nothing about morphology, pigmentation or nutritional quality, which keep responding at higher blue fractions. It also does not make the blue channel free: at 600 µmol·m⁻²·s⁻¹ total, a 10 percent share is 60 µmol·m⁻²·s⁻¹ of blue and a real line item on the electrical schedule.
Are blue light and UV-A the same thing for secondary metabolites?
No, and the difference is not semantic. UV-A is read mainly by UVR8 and quantified as cumulative exposure in kJ·m⁻², where rate and duration are not interchangeable because repair runs between exposures. Blue is read by cryptochromes and phototropins and quantified as a flux that saturates early. A blue-rich spectrum delivers no UV benefit.
Why does a blue-heavy spectrum cost more to run at the same PPFD?
Because a 450 nm photon carries more energy than a 660 nm photon, so a micromole of blue takes more electricity than a micromole of deep red at equal diode quantum efficiency — roughly 3.7–3.8 µmol/J against 5.4–5.5 µmol/J in that calculation. The penalty is a few percent at production shares and grows quickly in blue-dominated output.




Leave A Comment