
A grow room can look steady to the person standing in it and still modulate at full depth a thousand times a second. The reverse also happens: a fixture that bands badly on a phone screen may be comfortable to work under. Both observations are correct, because flicker and glare live in different domains — the time domain of the light-output waveform and the spatial domain of luminance in the observer’s field of view. Neither is described by the PPFD figure on a specification sheet.
What follows is the measurement logic lighting engineers apply to staff comfort in controlled-environment agriculture: how percent flicker is defined, where the IEEE 1789 recommendations place their boundaries, why dimming topology decides the outcome, why a top light that suits the canopy can be unpleasant at eye height, and what belongs in a purchase order instead of a marketing claim.

Flicker Is a Time-Domain Problem, Not a Frequency Spec
Flicker is a repetitive change in magnitude, or modulation, of a source’s luminous flux over time. That definition comes from the U.S. Department of Energy’s solid-state lighting briefing on the IEEE recommended practice, which also lists four governing factors: modulation frequency, modulation amplitude, the DC component, and duty cycle.
A driver switching at 2 kHz can still swing from full output to zero every cycle — 100% modulation at 2 kHz. A driver switching at 400 Hz while holding ripple inside a narrow band may stay under 10%. The first number sounds more modern; the second waveform is the calmer one.
The physics is simple. Mains AC is rectified to a DC rail and converted to a regulated current for the LED strings; whatever ripple survives the output filter becomes optical modulation, because LED output tracks forward current almost linearly with no thermal lag to integrate it. DOE test data makes the contrast concrete: a 60 W incandescent A19 measured 6.6%, a magnetically ballasted T12 tube 28.4%, a quad-tube compact fluorescent 57.0%, a phase-cut dimmed LED downlight 100% — the ballast or driver decides, not the emitter type.
Percent Flicker and Frequency: The Two Numbers You Must Report Together
Percent flicker uses a 0–100% scale and equals peak-to-peak amplitude divided by twice the average: 100 × (Max − Min) / (Max + Min). A square wave going fully on and fully off scores 100%; a ripple oscillating between 1.00 and 0.82 of nominal scores 100 × 0.18 / 1.82, about 9.9%. The DOE briefing is explicit about the limitation: the metric accounts for average and peak-to-peak amplitude but not waveform shape, duty cycle or frequency.
The companion metric, flicker index on a 0–1 scale, divides the area above the average line by total area under the waveform; it captures shape and duty cycle but says nothing about frequency. Hence credible reporting pairs a depth metric with a rate: “below 5% at 1.4 kHz” is checkable, “flicker free” is not.
IEEE 1789 turns the pairing into a boundary. The applied rule summarised in the DOE briefing is that maximum percent flicker should not exceed the flicker frequency multiplied by 0.08 — a low-risk ceiling of 8% at 100 Hz, 9.6% at 120 Hz, 40% at 500 Hz and 80% at 1 kHz. Above roughly 1.25 kHz the permitted modulation reaches the 100% ceiling of the scale and the curve stops binding, which is why high-frequency drivers are specified at all. A stricter no-observable-effect band sits below that line, so clearing it does not make a fixture comfortable for an eight-hour shift.
Two engineering targets follow, and both appear in horticultural specifications: at or above 1.25 kHz, percent flicker of 5–8% or lower at every dimming level is a reasonable comfort target; at or below 200 Hz with percent flicker above 20%, both the human and imaging channels should be re-examined before the room is staffed. Both can be written into a test report.
How Dimming Topology Creates (or Avoids) Pulsation
Pulse-width modulation holds LED current at rated amplitude and switches it on and off at a fixed rate, varying the on-fraction. The emitter is either at full current or zero, so the optical waveform is a rectangle and percent flicker sits near 100% at any dim level once rise and fall times are short against the period. At full output the duty cycle is 100% and the rectangle becomes a flat line, which is why a PWM fixture can measure clean at full power and poorly at 5%.
Constant-current amplitude dimming, normally driven by a 0–10 V analog signal, reduces the regulated current itself while the converter keeps switching at tens of kilohertz. The output filter attenuates that ripple, so the LED sees a slightly rippled DC level: low single-digit percent flicker across the range, at the cost of colour shift at very low current.
Hybrid designs run constant current down to a floor, often 10%, then hand the last decade to PWM. They dim deeply and efficiently, but the flicker profile is discontinuous: clean from 100% to 10%, abruptly rectangular below. That discontinuity is where complaints originate, because rooms are usually dimmed to the low end during maintenance and inspection, when people stand close to fixtures with tools in hand.
DOE data shows how much the dimmer interface alone changes the result: one LED lamp measured 1.8% flicker at full output and 15.8% at a deep phase-cut setting, while a different design measured 41.4% and 58.3%. A figure taken at 100% output says almost nothing about the setting staff work under.
Two Risk Channels: Human Perception vs Camera Rolling Shutter
The human channel is neurological and visual. Sensitivity peaks roughly between 3 and 70 Hz, where the retina and cortex follow the modulation instead of integrating it. At those rates the effects are the ones the DOE briefing lists: headaches, fatigue, blurred vision, eyestrain, migraine, reduced performance on visual tasks and distraction. Above a few hundred hertz direct perception fades, but two artefacts persist. The stroboscopic effect makes a fan blade or trolley wheel appear stationary or reversed, because light samples the scene at the modulation rate. The phantom array effect draws a saccading eye’s view of a modulated source as discrete dots rather than a continuous streak.
The imaging channel is a sensor artefact. A rolling-shutter camera exposes rows sequentially, so a source modulated at a rate that is not an integer multiple of the row readout draws horizontal bands that drift through the frame; a global-shutter or short-exposure still may show nothing. The camera is a poor proxy for the eye, sampling at tens of frames per second through a millisecond readout window — timelapse and security footage are the practical victims.
Remediation differs too. For the human channel, fix the driver: raise frequency, change topology, or set a dim floor. For the imaging channel, the camera can be fixed instead with an exposure time that is an integer multiple of the modulation period. Fixing the driver fixes both; fixing the camera fixes only the picture.
Glare at Staff Eye Height: Why PPFD Tells You Nothing
Glare is spatial, and the unit is luminance in candelas per square metre at the observer’s eye, not PPFD at the canopy. A top light can deliver a reasonable 600 µmol/m²/s at 0.4 m above the crop and still be a wall of light at 1.6 m, because the measurements sit at different distances and describe different things. PPFD counts photons landing on a horizontal surface; luminance describes how bright the emitting surface appears to someone looking at it.
Staff stand and walk with eyes roughly 1.5–1.7 m above the floor. At that height a bare LED board on an open frame is viewed at short distance and subtends a large solid angle, the geometric condition that produces discomfort glare. Indoor lighting practice handles this with the unified glare rating, which combines source luminance, apparent source size and background luminance — the framework maintained by institutions such as the Lighting Research Center. A full UGR calculation is rarely necessary in a grow room, but the logic transfers: discomfort scales with surface luminance and with how much of the field of view the source occupies.
As a working target, average luminance at eye height around 10,000 cd/m² or below is a sensible order of magnitude for a workspace occupied for hours. A bare emitter array viewed close up can be an order of magnitude above that, especially when individual diodes are visible. Two levers reduce it without touching the canopy photon budget: diffusing or louvring the aperture, and raising the mounting height.
Both cost output. A polycarbonate cover, prismatic sheet or honeycomb louver typically absorbs 5–12% of emitted flux, depending on material, thickness and dust accumulation. Raising the mounting height reduces canopy PPFD for a fixed beam angle and must be traded against the light recipe.
Measuring Flicker in a Real Grow Room
The instrument is a photodiode fast enough to follow the waveform, ideally with a cosine-correcting diffuser, feeding a transimpedance amplifier and an oscilloscope. Sample at 10 kHz or more, with bandwidth covering the pulse harmonics — otherwise a 1 kHz square wave is recorded as a smoothed sinusoid and its depth understated. Record at least 2 seconds per dimming setting and report frequency with percent flicker and the dim level.
Sample the settings the room actually uses: full output, production level, maintenance level, and the controller’s minimum. In a hybrid driver those are four different waveforms, and the last two are usually the worst. Where a room holds many fixtures, measure more than one: drivers of the same model from different batches can differ by tens of hertz, and two sources a few hertz apart create a slow beat at the difference frequency. Units at 1,000 Hz and 1,003 Hz produce a 3 Hz wobble neither generates alone.
Phone cameras are useful for triage and useless as acceptance evidence. A fixed shutter near 1/1000 s, fixed ISO and fixed white balance reveal whether banding exists and roughly how coarse it is — enough to justify bringing an oscilloscope, not enough to declare compliance, because a camera sampling at an integer multiple of the modulation period produces a clean frame from a source with 100% modulation.
Dimming Architecture Comparison
The table summarises how common architectures behave on the parameters that matter for staff comfort. Percent-flicker figures are order-of-magnitude expectations, not guarantees; the defensible number is the one measured on that fixture at that dim level.
| Dimming / driver topology | Typical modulation frequency | Percent flicker at 1–5% dim | Human-channel risk | Camera / imaging impact | Primary mitigation |
|---|---|---|---|---|---|
| PWM, low frequency | 200–500 Hz | 60–100% | High: visible flicker, stroboscopic and phantom array effects | Strong banding at most shutter speeds | Raise switching frequency; avoid deep dimming |
| PWM, high frequency | 1,000–3,000 Hz | 90–100% at 1% duty, above the perceptual peak | Low for direct perception; residual stroboscopic risk on fast motion | Banding reduced but possible at short exposures | Keep duty above 10%; use amplitude dimming below that |
| Constant-current amplitude (0–10 V) | Converter at 20–100 kHz, filtered | 1–5% | Low across the range | Minimal banding | Verify colour stability at low current |
| Hybrid (constant current, then PWM) | 1,000–3,000 Hz in the bottom decade | 2–5% above 10%; near 100% below it | Discontinuous: clean in production, poor at maintenance levels | Banding only at the low end | Set the dim floor above the crossover |
| Phase-cut dimming on an LED load | Tied to mains, 100 or 120 Hz | 15–100%, driver dependent | High | Severe banding | Replace with a 0–10 V or DALI driver |
Two rows deserve a second reading. The high-frequency PWM row looks acceptable on the human channel because the rate sits above the sensitive band, yet the depth is still essentially total — which is why the camera and stroboscopic channels do not disappear. The phase-cut row catches retrofit projects, where a bench-quiet driver becomes the noisiest fixture in the room behind a triac dimmer.
Fixing Flicker and Glare Without Killing Output
If the measurement shows a low-frequency PWM driver, the correct fix is a driver change, not a diffuser. Moving the switching frequency to 1–3 kHz pushes the fundamental above the perceptual peak and shrinks the camera’s exposure window relative to the period. Added output capacitance can reduce ripple depth on constant-current designs, but cannot help a genuine PWM output stage: the rectangle is generated deliberately, and smoothing it means changing topology.
If the fixture is a hybrid crossing into PWM at low dim, the cheapest intervention is a control change: set the dim floor at or above the crossover, typically 10%, and accept that the room will not go darker. Where deeper dimming is genuinely needed, the honest solution is a driver with amplitude dimming across the full range.
Glare responds to geometry: a diffuser or louver, a higher mounting height, a narrower beam, or re-aiming away from walkways are reversible changes that can be trialled in one bay before committing the room. Measure luminance at eye height with a luminance meter before and after; do not infer it from the PPFD grid, because the quantities are not convertible.
Where These Trade-offs Matter in Practice
The parameters become a specification rather than a debate once a project has a working height, a dim range and a shift pattern. In a vertical farm or multi-tier rack room, where staff work with heads close to the fixture plane, the eye-height luminance constraint usually binds before the flicker constraint. In a single-layer greenhouse with 2 m mounting height, the reverse is often true and the dim-level waveform is the item worth auditing.
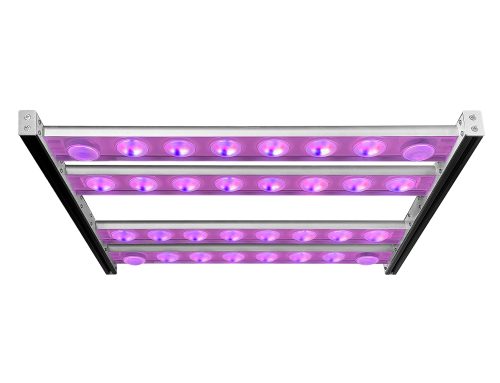
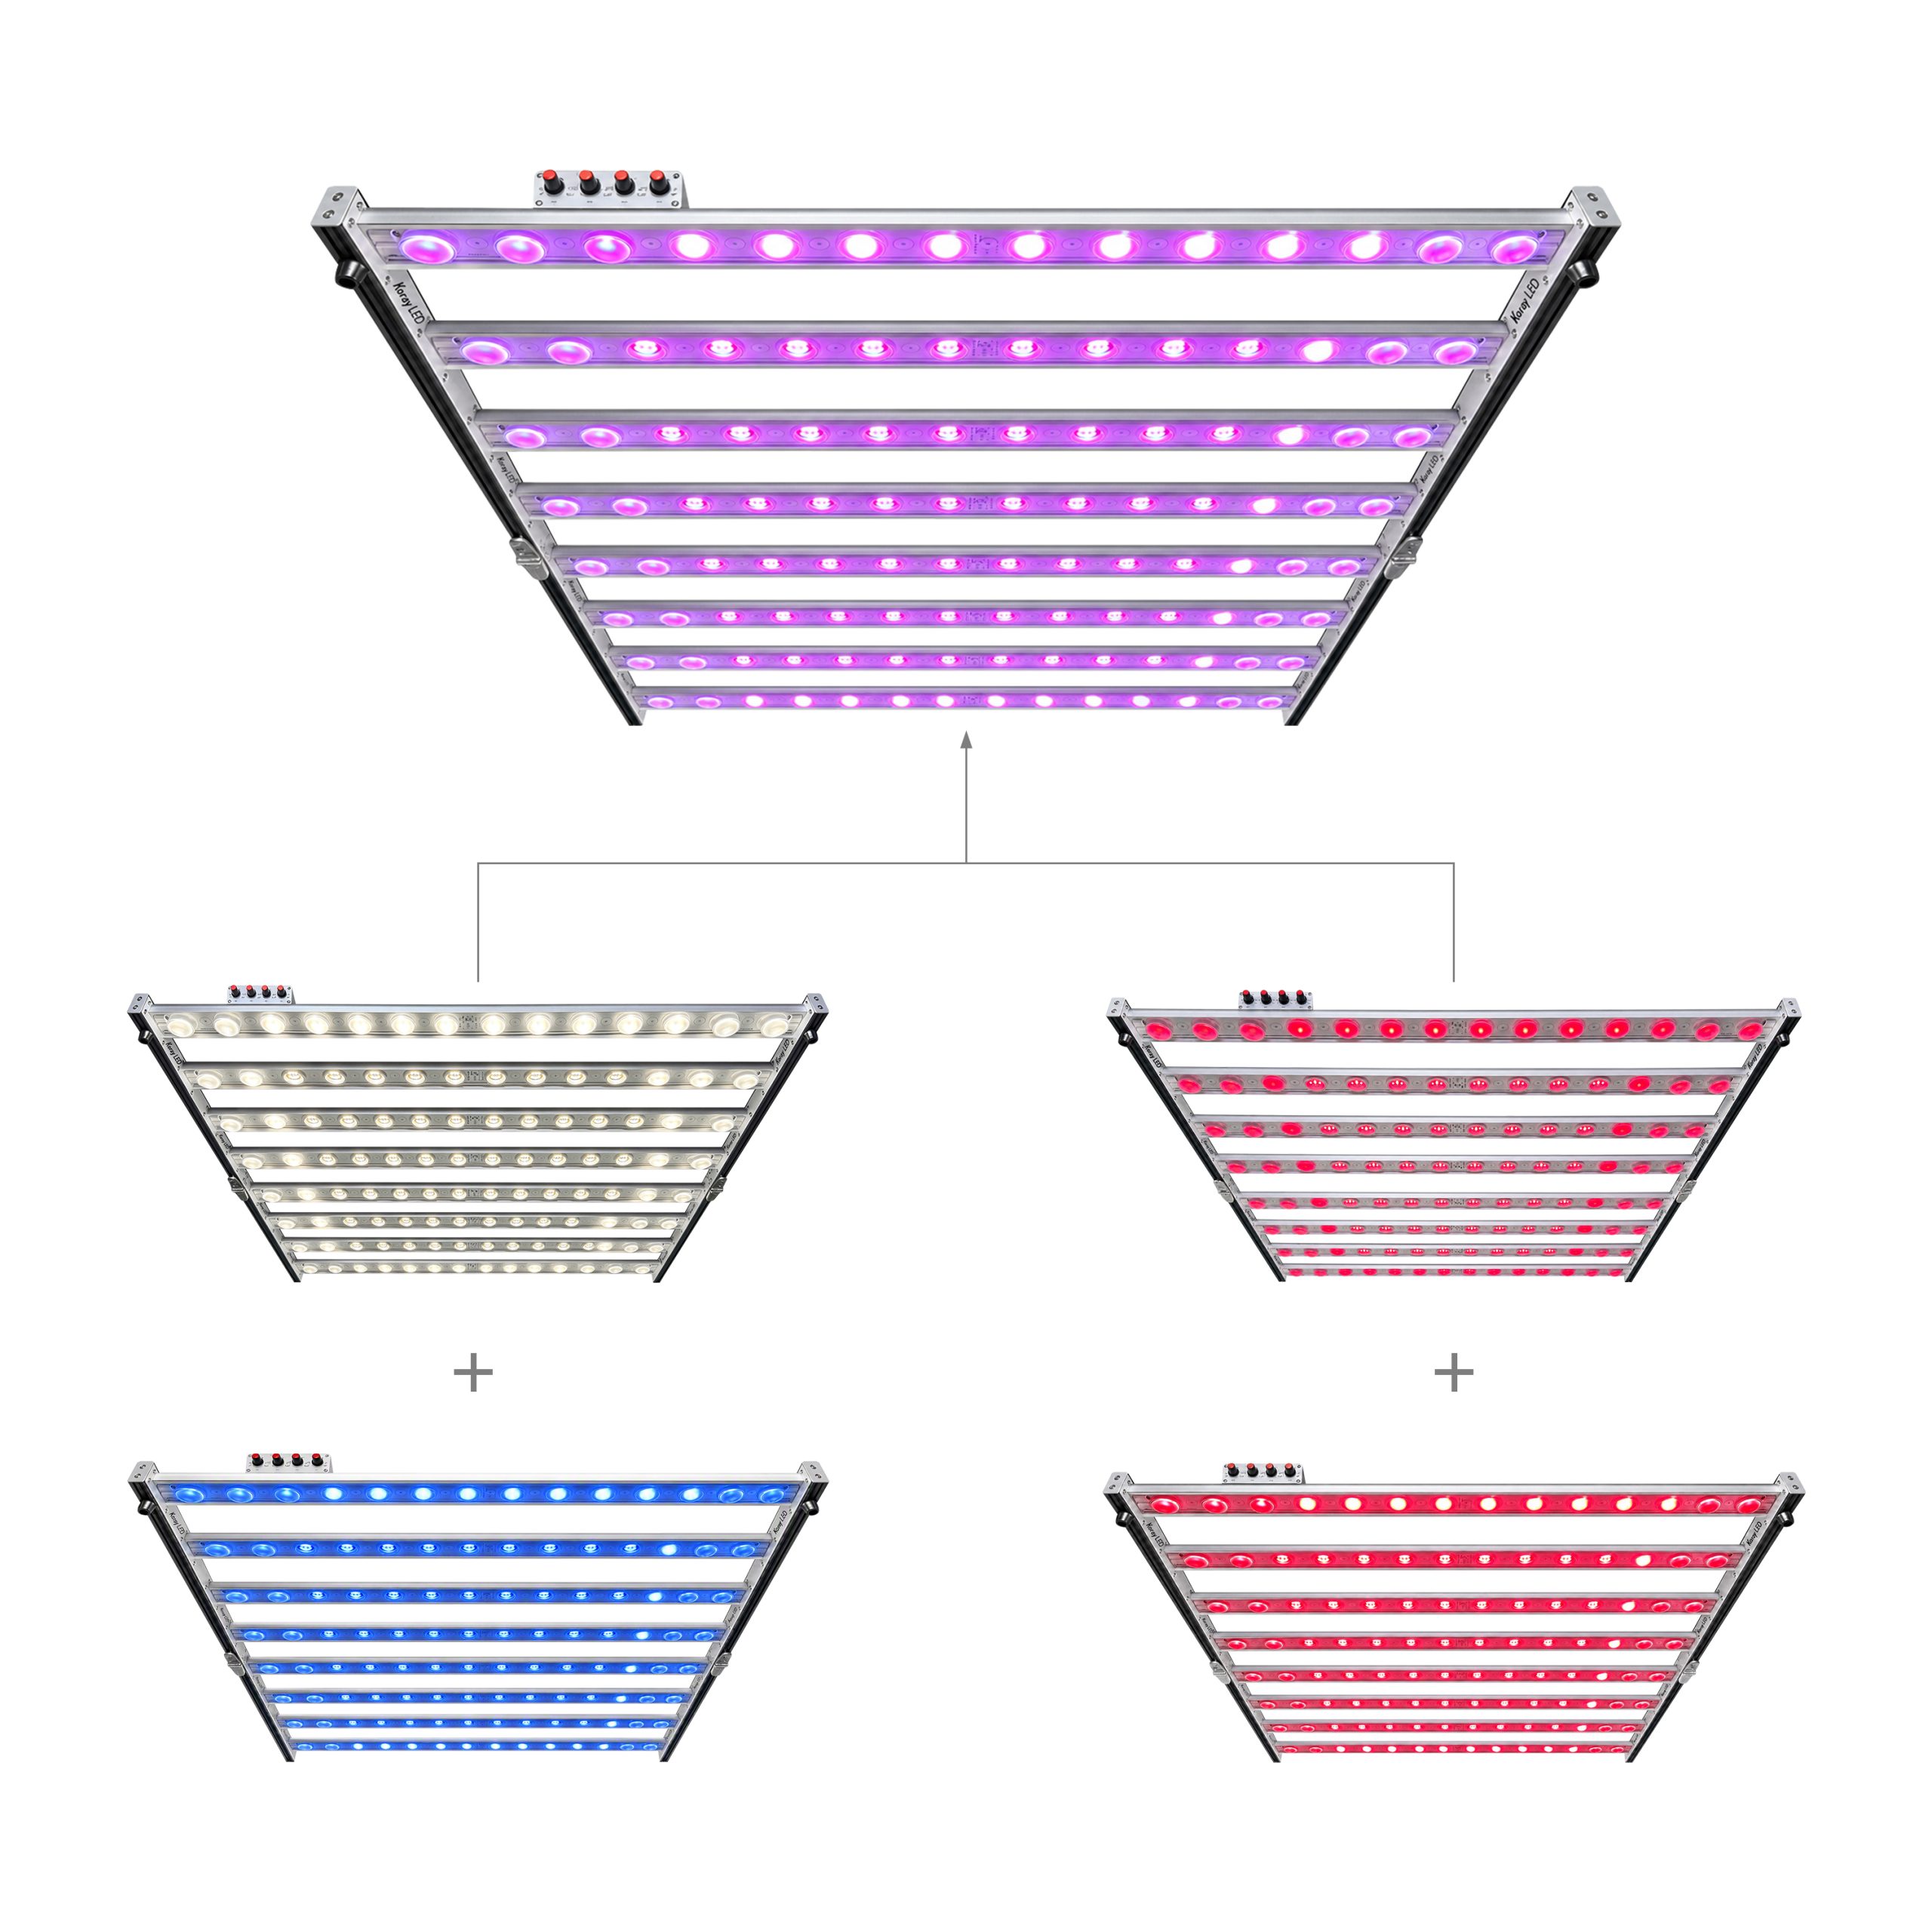
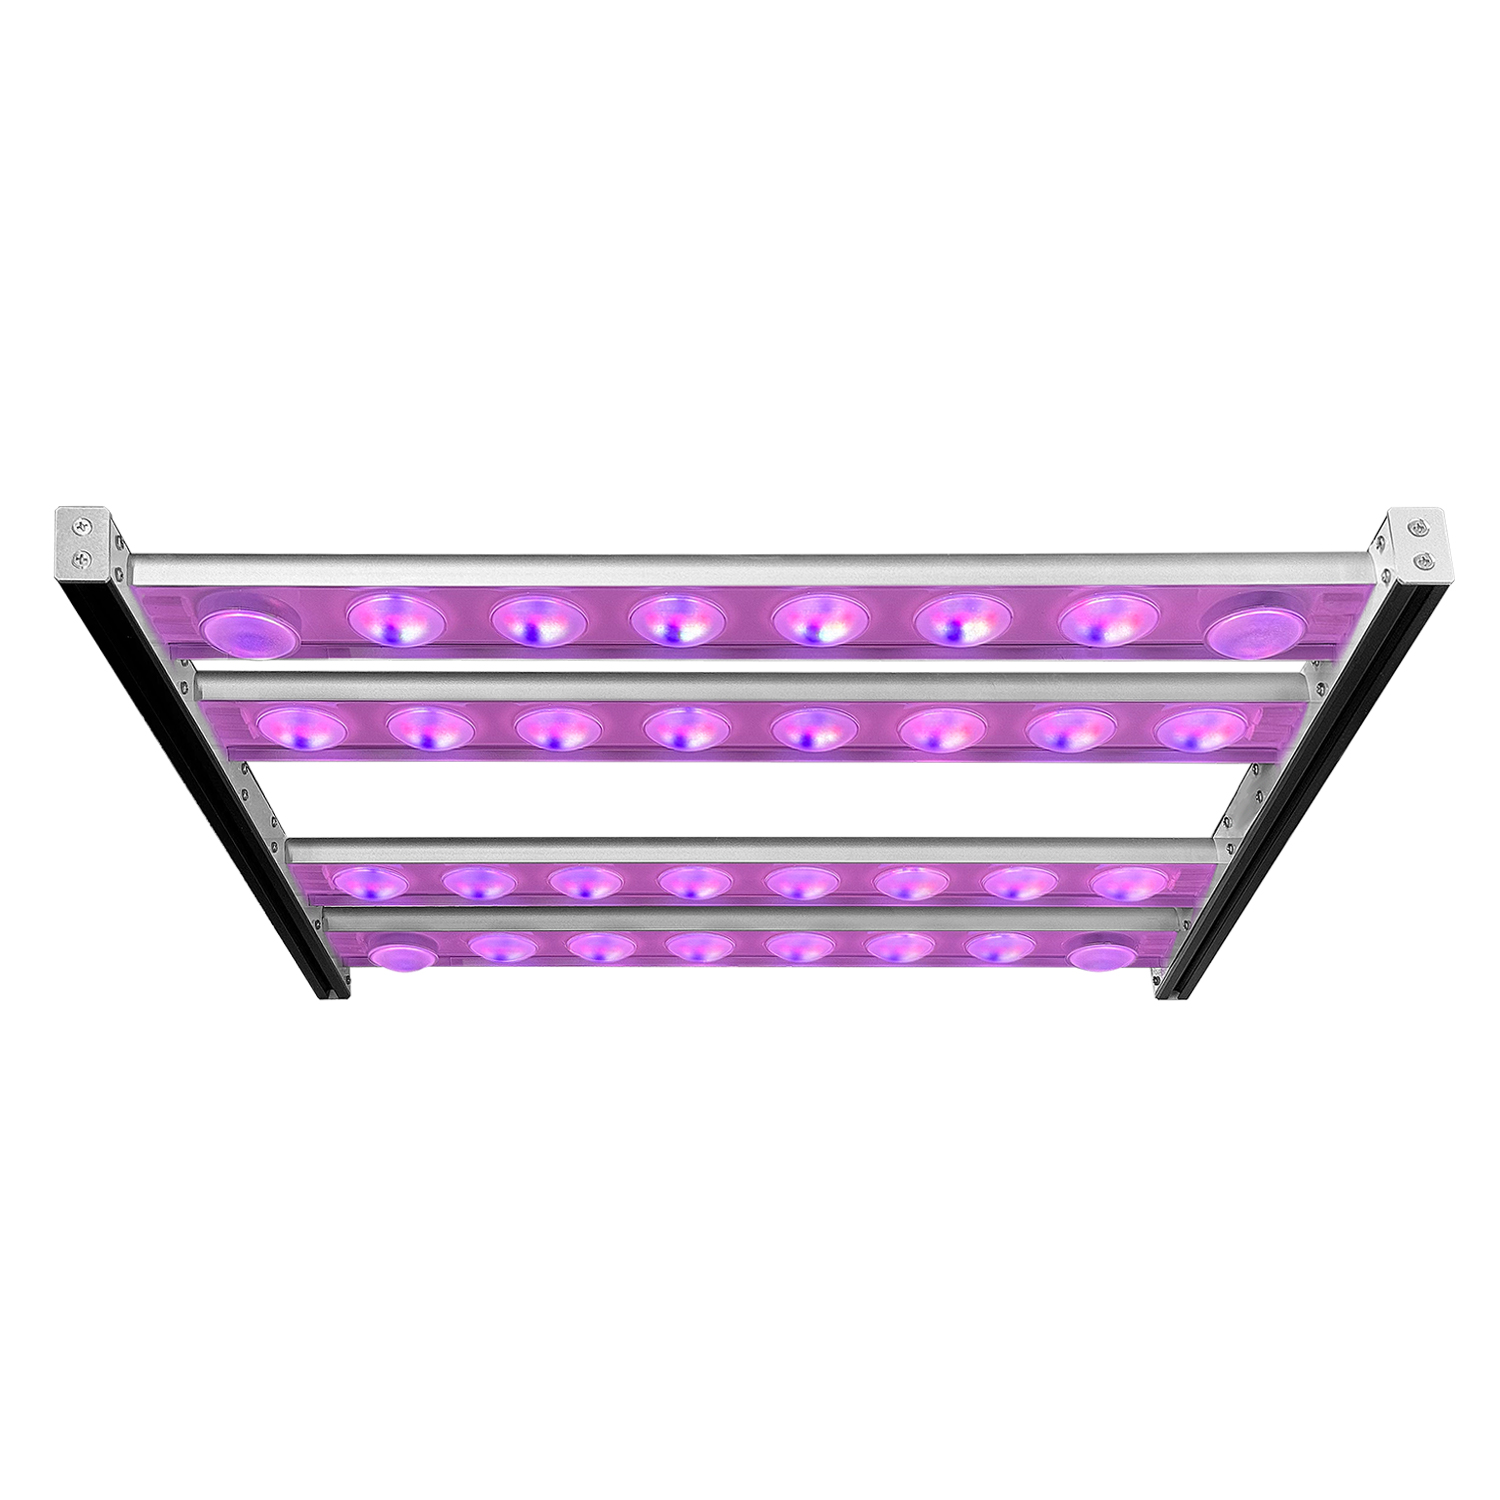
Koray has been manufacturing horticultural lighting for 17 years, and the questions from integrators have shifted from “is it flicker free” to “what is the percent flicker at 10% dim, and what is the eye-height luminance with the cover fitted”. The G630 top light and G4000H module families are typically specified with a dimming scheme chosen for the room’s working pattern, and a measured report at the production dim level is the acceptance document.
Procurement Checklist: What to Ask Before You Buy
- State dimming topology and minimum dim ratio as separate line items; “1% dimmable” without topology is not a specification.
- Require percent flicker and switching frequency as a pair, at 100%, 50%, 10% and the minimum dim level.
- Ask for measurement conditions: photodiode type, oscilloscope sampling rate, record length, and whether a diffuser was fitted.
- Ask for the flicker figure with the production cover or louver installed, since the diffuser changes both the waveform and eye-height luminance.
- Specify the eye-height luminance target and the mounting height at which it was evaluated, and require a luminance measurement rather than a PPFD grid.
- Require one driver model and firmware revision per zone, so beat frequencies between units do not appear.
Common Mistakes
- Treating frequency as the flicker specification and never asking for modulation depth at the dim level in use.
- Measuring only at full output, where a PWM driver is at 100% duty and at its cleanest.
- Judging glare from the PPFD grid, which says nothing about luminance at eye height.
- Assuming a diffuser is a flicker fix: it lowers glare but cannot change a PWM stage’s duty cycle.
Conclusion
Flicker and glare are separate engineering problems sharing one room, and neither is settled by an adjective on a datasheet. Percent flicker and frequency must be reported together at the dim levels staff actually use; the IEEE 1789 boundary of roughly 0.08 × frequency gives a checkable ceiling rather than a slogan; dimming topology predicts the waveform better than emitter technology does; and glare at 1.5–1.7 m is a luminance question a PPFD map cannot answer.
Frequently Asked Questions
Is a higher PWM frequency always better?
Not unconditionally. Raising switching frequency moves the fundamental above the band the visual system follows and shortens the pulse relative to a camera’s exposure, but it also increases switching losses and can worsen electromagnetic emissions. The practical target is a frequency above the perceptual peak combined with tolerable modulation depth.
Why does my light look fine but flicker on camera?
The camera and the eye are different detectors. A rolling-shutter sensor exposes rows sequentially over several milliseconds, so a source modulated at a rate that is not an integer multiple of the row readout produces drifting bands, while the eye integrates the same waveform above a few hundred hertz without visible artefact. Setting exposure to an integer multiple of the modulation period removes the banding.
Does flicker affect the plants?
This analysis addresses the human and imaging channels only. Plant responses are governed by spectrum, PPFD and the daily light integral — the cumulative photon dose per day in mol/m²/d, defined by Michigan State University Extension — not by the modulation depth discussed here. Claims that a frequency improves yield need controlled trial data.
Can I fix flicker by changing the driver only?
Sometimes. If the fixture uses a PWM or hybrid output stage, replacing the driver with a constant-current amplitude design, or one switching at 1–3 kHz with a 10% dim floor, removes most modulation at the settings staff use. Glare at eye height will not improve, because that is geometry.
What should I specify in a purchase order?
Four fields cover most of the risk: dimming topology and minimum dim ratio; percent flicker and frequency reported together at 100%, 50%, 10% and minimum dim; eye-height luminance with the production cover fitted at the stated mounting height; and confirmation that all drivers in a zone share one model and firmware revision.



Leave A Comment