
Ultraviolet A is the part of a grow-light conversation that falls outside the vocabulary most cultivators already own. It is not counted by a PAR meter, it is not part of PPFD or DLI, and its dose is expressed in units that do not appear anywhere on a photon-flux specification sheet. That mismatch is the source of most of the confusion around the band.
This article stays on the plant side of the question: what 315–400 nm does inside leaf tissue, what the evidence on secondary metabolism does and does not support, and how to structure a dose you can actually measure and repeat. Photobiological safety for the people working under UV-emitting fixtures is a separate subject with its own standard, and it is treated as a boundary here rather than a topic.
Where UV-A Sits Relative to PAR
UV-A is the 315–400 nm band, the long-wave portion of ultraviolet radiation. The neighbouring bands are conventionally named UV-B at 280–315 nm and UV-C below 280 nm. These boundaries are a naming convention, used consistently across photobiology so that a stated band means the same thing in two different papers.
PAR is defined as the 400–700 nm waveband, and that definition is what makes UV-A unusual: it sits immediately below the PAR boundary and therefore outside it. A PAR quantum sensor does not report UV-A, and UV-A photons do not enter a PPFD figure or a DLI total, however much UV-A a fixture emits.
The practical result is a blind spot. A grower can hold a calibrated quantum sensor under a fixture, read a clean PPFD number, and have no information at all about whether the same fixture is emitting UV-A. The meter is not faulty; the band is simply outside what the instrument is built to count.
Why UV-A Dose Is Measured in Energy, Not Photon Count
Because UV-A lies outside PAR, the µmol convention does not apply to it. UV-A is specified as an energy quantity: irradiance in W·m⁻², and dose in kJ·m⁻²·d⁻¹ accumulated over a photoperiod.
The two families of units are not interchangeable, and treating them as if they were is the most common arithmetic error in UV discussions. Photon flux counts particles; irradiance sums energy. A photon at 365 nm carries roughly 5.45 × 10⁻¹⁹ J, computed from E = hc/λ, so one micromole of 365 nm photons carries about 0.328 J. That conversion factor is specific to the wavelength it was computed for — a 385 nm photon carries less energy than a 365 nm photon, so a single multiplier cannot be reused across the band.
Dose follows from irradiance and time:
Dose (kJ·m⁻²·d⁻¹) = irradiance (W·m⁻²) × exposure time (s) ÷ 1,000
Read that formula as a budget, not a recommendation. It says that the same daily dose can be delivered as a high irradiance for a short window or a low irradiance for a long one, and that the two are not automatically equivalent for the plant, because repair and signalling processes run on their own timescales. The formula tells you what you delivered; it does not tell you what the crop did with it.
What the numbers on a datasheet do and do not cover. For the fixtures discussed in this article, UV-A output is not specified in the official datasheet — no UV-A wattage, no µmol figure and no percentage of total output is published. That is not an omission to be filled in by estimation. It means UV-A must be measured at the canopy with a UV-capable radiometer if it is going to be dosed deliberately at all.
What UV-A Does Inside Leaf Tissue
UV-A is absorbed strongly in the epidermis, by flavonoids, anthocyanins and other phenolic compounds that accumulate in the outer cell layers. Those compounds act as a screening layer: a large share of the UV-A entering a leaf is attenuated before it reaches the mesophyll where most photosynthetic tissue sits.
This is the structural reason UV-A behaves differently from a PAR photon. A red or blue photon is a substrate for photosynthesis; a UV-A photon is, to a first approximation, a signal that is read at the surface of the leaf and largely filtered out before it can be used as energy. The epidermal screen is also inducible — tissue grown under UV-A tends to build a thicker one, which changes how much of a subsequent dose gets through.
That inducibility is what makes UV-A interesting for secondary metabolism and what makes dosing non-linear. A dose that is modest for an unacclimated crop can be substantially screened by an acclimated one, and the plant’s own response changes the effective internal dose over time.
Reading the Secondary-Metabolism Evidence Without Overclaiming
The reported direction of the response is consistent: supplemental UV-A is used in controlled environments to study secondary-metabolism and morphology responses, and the published work points to up-regulation of phenolic and flavonoid pathways along with changes in leaf thickness and habit. Utah State University’s Crop Physiology Lab, which documents photobiology and light-quality research, describes this plant-side work directly.
What the evidence does not support is a number. Effect size is species-dependent, cultivar-dependent and dose-dependent, and any single percentage quoted for “UV-A increases antioxidants by X” should be treated as a claim about one experiment rather than a rule for a crop. This article therefore states direction without magnitude. Michigan State University Extension’s light quality publication is a useful companion for the wider spectral picture around the band.
Mechanism deserves the same discipline. UV-B responses are mediated largely by the UVR8 photoreceptor. UV-A responses involve cryptochrome and other pathways that are only partly resolved, so it is inaccurate to describe UV-A as “working through UVR8” — a shortcut that appears often in product copy and is not supported by the photobiology literature.
Morphology effects are part of the same response. Compact habit, shorter internodes and thicker leaves are commonly reported alongside the phenolic changes, and they matter commercially because they change how a canopy fills a space. They are also the effects most likely to be overdriven: the same signalling that produces a desirable compact plant can, at higher irradiance or longer exposure, produce leaf-margin damage. Direction and magnitude have to be assessed separately, which is what the dosing section below is for.
A Dosing Protocol You Can Actually Run
The following is practice guidance assembled from how controlled-environment UV-A work is normally run. It is not an official specification, and it is not a substitute for measuring the fixture in your own room.
1. Start with a short daily window, not the full photoperiod. A UV-A window placed inside the photoperiod, rather than running for its entire length, keeps the daily dose bounded and makes the effect of a change attributable to that change. 2. Ramp over days, not minutes. Begin at a fraction of the intended irradiance and increase in steps across one to two weeks, watching new growth rather than old leaves. Old tissue carries the damage history; new tissue shows the current dose. 3. Measure at the canopy, at the intended mounting height. UV-A irradiance falls off with distance like any other radiation, so a reading taken at the fixture face is not the dose the crop receives. 4. Watch the leaf margins and the youngest fully expanded leaves. Margin scorch and cupping are the earliest visible signals that the dose has moved past the useful range, and they appear before yield or quality effects would. 5. Change one variable at a time, and keep a control zone. Because UV-A output is not published in official datasheets, the only reliable baseline is a measured one — an untreated block under the same fixture and the same PAR.
Two cautions complete the protocol. Do not stack UV-A on top of an already stressed crop; stress responses share pathways with UV responses, and the combined result is not additive in a predictable way. And do not assume that a fixture marketed as “full spectrum” delivers a meaningful UV-A dose — outside PAR, that term carries no defined meaning.
Where Plant Dose Ends and Human Exposure Begins
UV-A is a photobiological agent, and a person standing under a UV-emitting fixture is a different subject from a leaf standing under the same fixture. Human exposure falls under IEC 62471, the photobiological safety standard for lamps and lamp systems, which classifies products by risk group and sets the measurement framework for eye and skin exposure.
That question is covered in our earlier article on human perceived comfort in LED grow lights, and it is deliberately not re-argued here. The distinction this article depends on is simple: a dose that is agronomically useful to a crop is not thereby safe for a worker, and a fixture that is safe for a worker is not thereby delivering a useful plant dose. The two assessments use different metrics, different limits and different instruments, and passing one says nothing about passing the other.
Comparing UV Bands With PAR Bands
The table below sets UV-A against its neighbours on the dimensions that determine how each band is measured and what it is used for. Where a figure is not published by the fixture manufacturer, the cell says so rather than offering an estimate.
| Dimension | UV-C (<280 nm) | UV-B (280–315 nm) | UV-A (315–400 nm) | Blue PAR (400–499 nm) |
|---|---|---|---|---|
| Inside the PAR band | No | No | No | Yes |
| Reported by a PAR quantum sensor | No | No | No | Yes, in µmol·m⁻²·s⁻¹ |
| Dose unit | Energy: kJ·m⁻²·d⁻¹ | Energy: kJ·m⁻²·d⁻¹ | Energy: kJ·m⁻²·d⁻¹ | Photon flux: mol·m⁻²·d⁻¹ |
| Established plant pathway | Direct nucleic-acid damage at sufficient dose | Largely UVR8-mediated | Cryptochrome and other, partly unresolved pathways | Cryptochrome, chlorophyll absorption |
| Typical control use | Surface and water disinfection, not crop lighting | Research-scale stress studies | Secondary-metabolism and morphology studies | Photomorphogenesis and photosynthesis |
| Output published in official datasheets | Not specified in the official datasheet | Not specified in the official datasheet | Not specified in the official datasheet | Not specified in the official datasheet |
Fit for Your Site
Koray has built LED grow lights for 17 years, and the recurring pattern in that work is that UV-A is the channel most often added last and specified least. The band rewards a measured approach and punishes an assumed one, because nothing on a standard photon-flux datasheet constrains it.
For a commercial installation, three practices keep UV-A from becoming an unquantified variable:
- Treat UV-A as an optional channel with its own meter. Budget for a UV-capable radiometer alongside the quantum sensor, and record canopy irradiance at the mounting height you will actually use.
- Write the window into the recipe. Specify start time, duration and irradiance for the UV-A window in the same document that holds the photoperiod and the fertigation schedule, so a shift change cannot silently extend it.
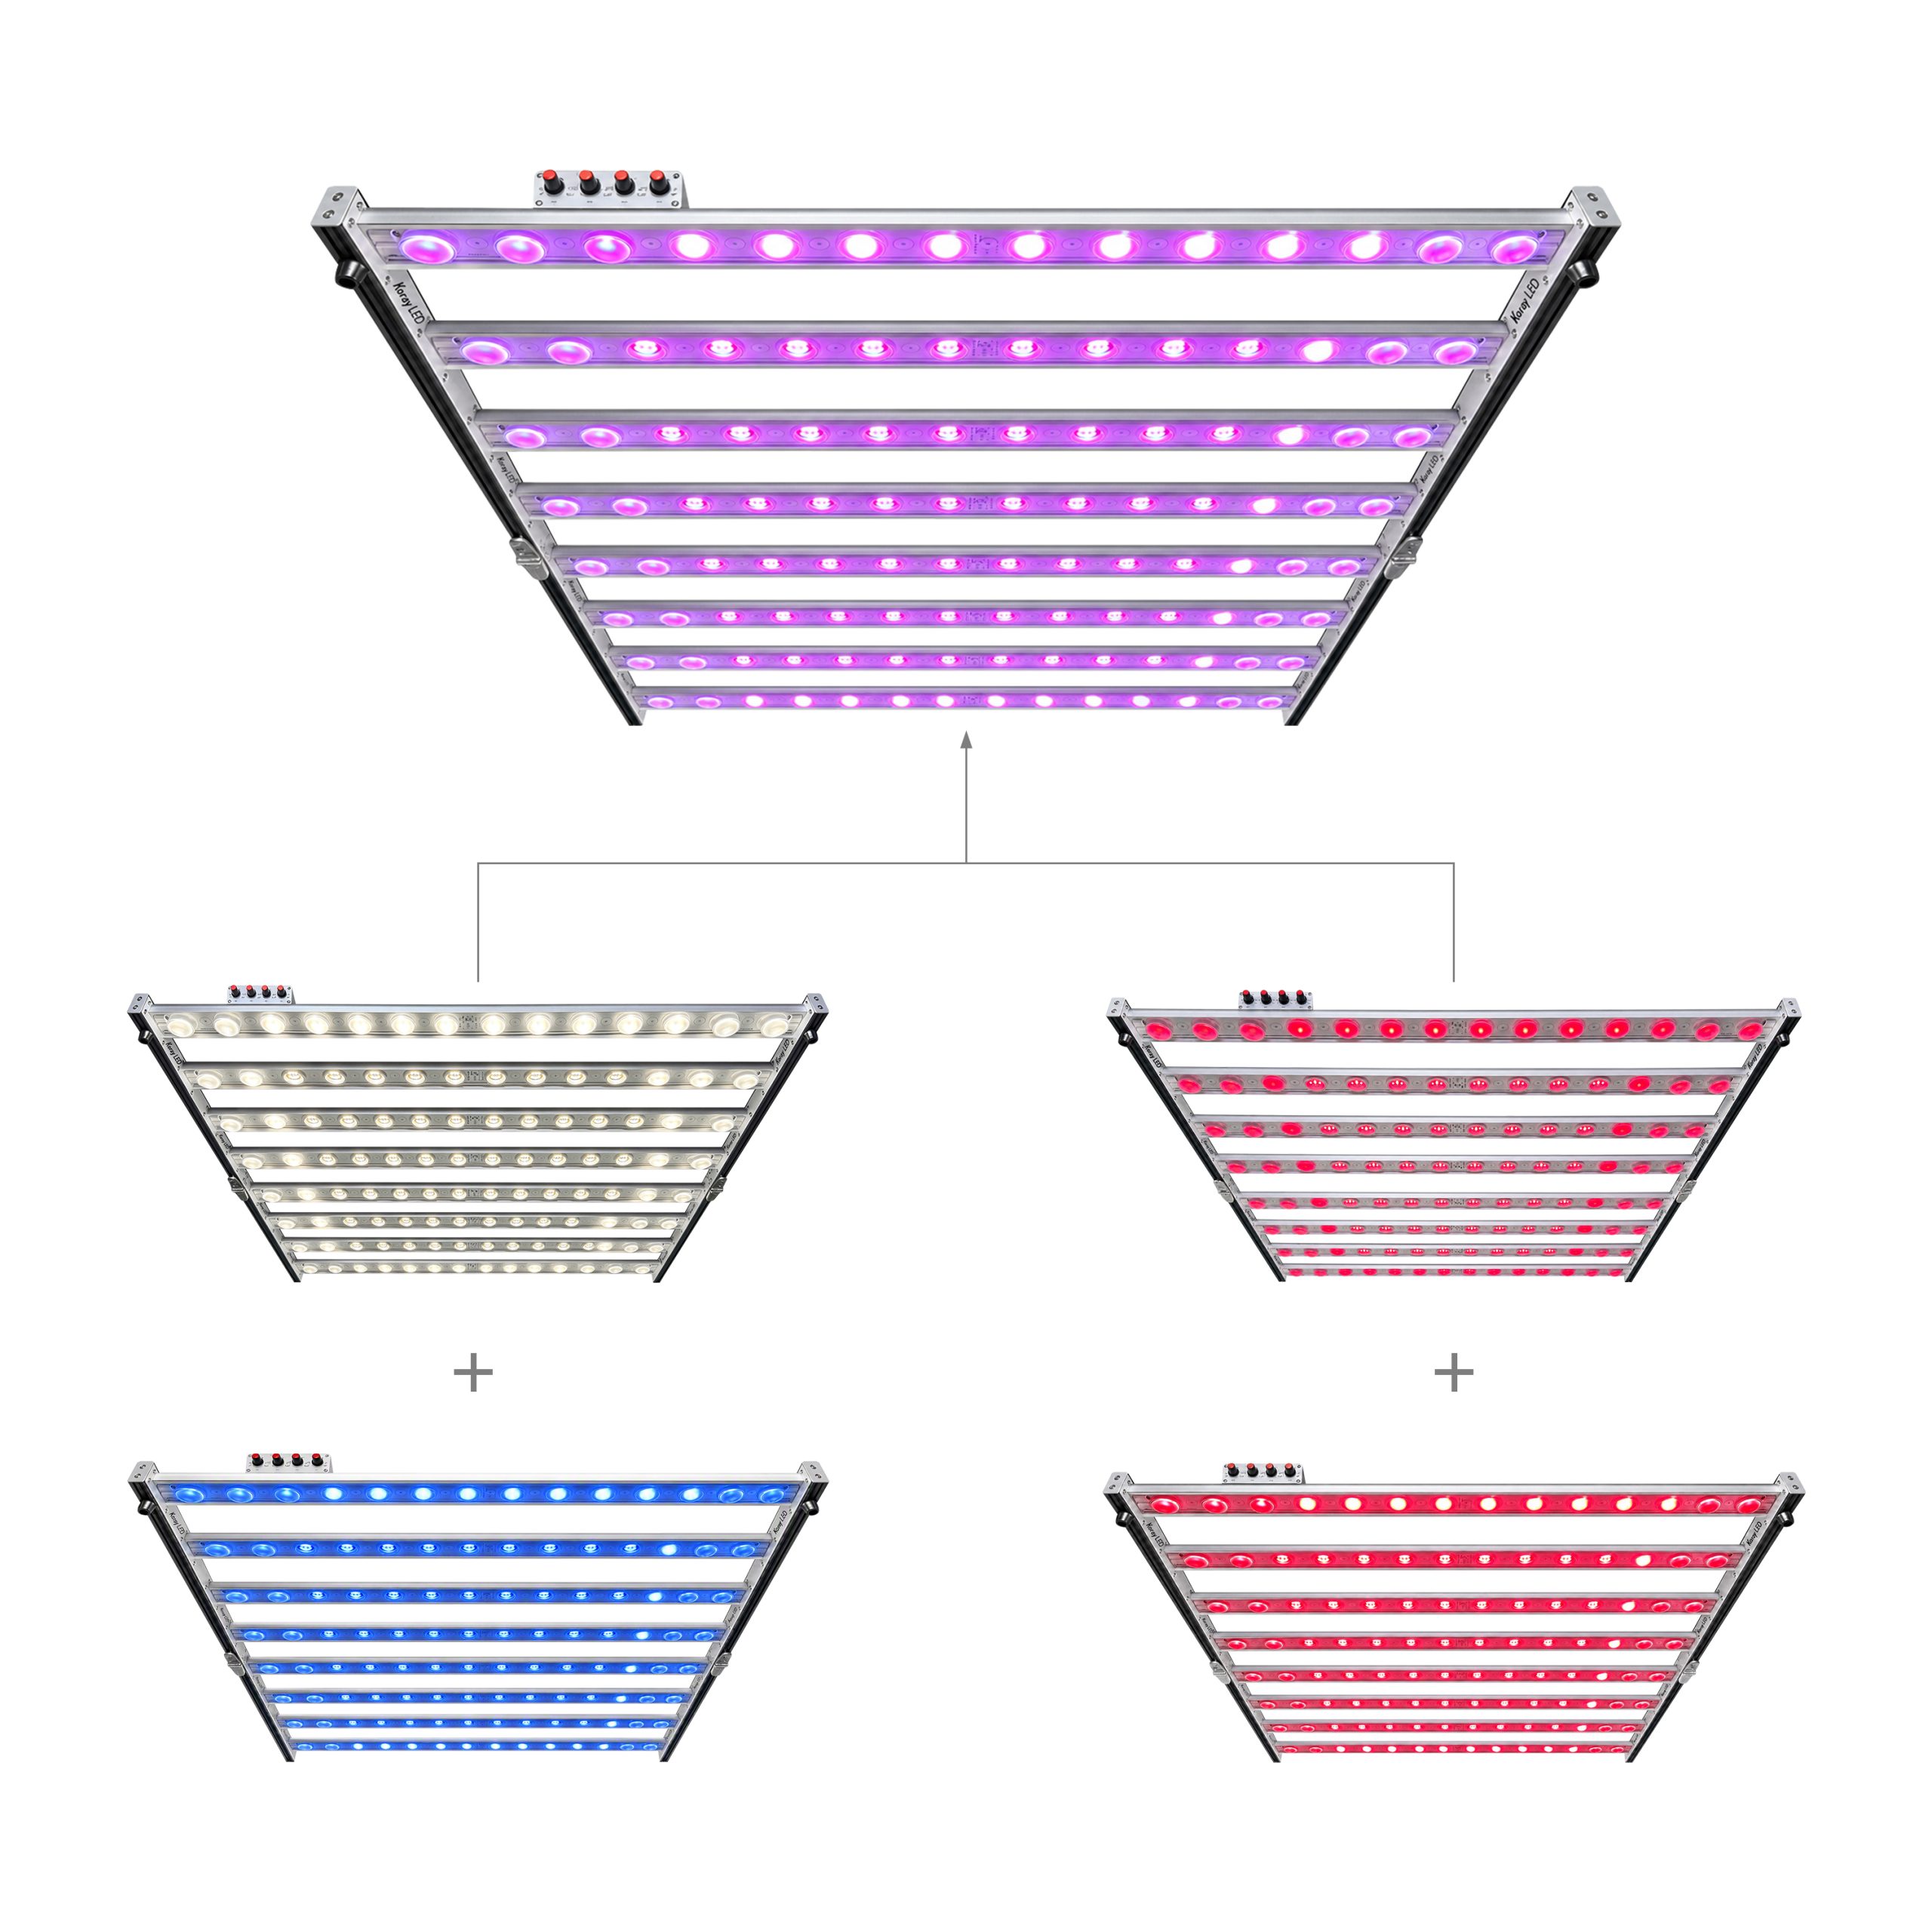
- Keep it separable. A fixture with independently controlled channels lets UV-A be switched off for a control block and for propagation, where the crop has no acclimation yet. The ARZ-G45 bar series offers independent channel control for this reason; the official datasheet does not state a UV-A output figure for it, so the dose still has to be measured.
FAQ
Is UV-A part of PAR or PPFD?
No. PAR is defined as the 400–700 nm waveband and UV-A occupies 315–400 nm, immediately below that boundary. A PAR quantum sensor does not report UV-A, so UV-A photons do not enter a PPFD reading or a DLI total.
How is UV-A dose measured?
UV-A dose is an energy quantity: irradiance in W·m⁻² and daily dose in kJ·m⁻²·d⁻¹, calculated as irradiance multiplied by exposure time in seconds and divided by 1,000. These units are not interchangeable with µmol·m⁻²·s⁻¹, which counts photons rather than summing energy.
Does UV-A increase secondary metabolites?
The reported direction is up-regulation of phenolic and flavonoid pathways, and UV-A is used in controlled environments to study exactly those responses. Effect size is species-dependent, cultivar-dependent and dose-dependent, so this article states the direction without attaching a percentage to it.
Should UV-A run for the whole photoperiod?
Practice guidance points to a short daily window inside the photoperiod rather than full-length exposure, with the irradiance ramped up over one to two weeks and leaf margins watched for scorch. Because fixture UV-A output is not specified in the official datasheet, the window has to be set from a canopy measurement rather than from a datasheet figure.
Is UV-A a human safety topic?
Yes, but as a separate assessment. Human exposure to UV-A from lamps is handled under IEC 62471, which classifies products by photobiological risk group. This article covers the plant-side dose only; the human-exposure side is addressed in our article on human perceived comfort in LED grow lights.
Conclusion
UV-A at 315–400 nm is a band that a PAR meter cannot see and a photon-flux datasheet cannot constrain. Its dose belongs in energy units, its plant effects run through an inducible epidermal screen rather than through photosynthesis, and its metabolic benefits are real in direction but variable in magnitude. The workable approach is unglamorous: measure the irradiance at the canopy, bound the daily window, ramp slowly, keep a control block, and treat the band as a specified channel rather than an atmospheric claim.




Leave A Comment