
Colour consistency describes how closely two light sources of the same nominal colour match each other. In horticultural lighting the topic is usually discussed as a question of appearance, meaning how a room looks to the people who work in it, and that framing leaves out the larger effect. In a multi-channel fixture the spectrum that reaches the canopy is a weighted mixture of the spectra of the individual channels, and the weights are set by the dimming recipe rather than by anything a diode package controls on its own. A chromaticity spread between samples therefore propagates into the delivered spectrum, and a spectrum that varies from one point of the canopy to another is a signal that varies as well. This article explains what a MacAdam ellipse measures, what an SDCM step counts, how a multi-channel fixture changes the question, and which documents turn a colour claim into something a buyer can verify.
What a MacAdam Ellipse Measures
A chromaticity diagram is a map of colour as a standard observer registers it, built from two coordinates that locate a colour independently of how bright it appears. On such a map, a MacAdam ellipse is the region of the diagram within which a standard observer cannot reliably distinguish a colour from the colour at the centre of that region. The shape is not a circle: its axes differ in length according to the direction in which colour is displaced, so a tolerance of the same size in coordinate units represents a different perceptual distance depending on where the centre point sits.
The ellipse is also tied to the conditions under which it was derived. It comes from visual matching experiments run at a fixed luminance level with a defined adaptation state, which makes an ellipse a statement about a measurement condition as much as a statement about a colour. The colorimetric quantities, the observer functions and the tolerances derived from them are standardised through the publications of the International Commission on Illumination, whose Colorimetry handbook is the reference text for the definitions used here (https://cie.co.at/publications/colorimetry-4th-edition).
What an SDCM Step Counts
SDCM stands for standard deviation of colour matching. A one-step MacAdam ellipse is the region whose radius corresponds to one standard deviation of the colour matches made by a panel of observers against a reference colour, so an SDCM step is one standard deviation of colour matching and a bin quoted as three-step covers a region three times the radius of a one-step ellipse around its centre. Step counts are therefore comparable across suppliers even when the underlying ellipses are not circles, because the step is a unit and the ellipse describes the local shape of the tolerance in that unit.
In the general lighting trade, tolerances are normally quoted between one step and seven steps, and three-step and five-step bins are the most commonly offered. A one-step or two-step tolerance sits near the limit of what a spectroradiometer can separate between samples; a three-step tolerance is narrow enough that two samples side by side are hard to tell apart without instrumentation; a five-step tolerance is the ordinary commercial compromise; and a seven-step tolerance is loose enough that differences between adjacent fixtures can become visible on a large surface. Those descriptions are conventions of the trade rather than thresholds defined by plant biology, and they should be read as such.
One limitation follows from the definition. An SDCM tolerance is a two-dimensional tolerance in chromaticity coordinates: it says where a colour point sits, not how much energy a source emits at 660 nm, not the shape of its spectral power distribution between the bands, and not how its flux is distributed. For a horticultural source those are separate properties with separate measurement paths, so a tight colour bin is one clause of a specification rather than a summary of it.
Binning Is Several Sorts, Not One Label
Binning is the sorting of light-emitting diodes from a production run into groups that share a measured range for one quantity, so that a luminaire built from parts drawn from the same group behaves consistently. Within a single wafer the emitted wavelength and the flux vary from die to die, and across a batch the variation is wider still, which is why a manufacturer measures every die and sorts it rather than selling an average.
Three sorts matter to a specifier, and they are independent. The first is the flux sort, which for horticulture is normally a radiant flux sort over the 400 to 700 nanometre waveband in micromoles per second rather than the luminous flux sort used for general illumination. The second is the forward voltage sort, which decides how many diodes can share one driver channel. The third is the chromaticity sort, where the MacAdam step and the SDCM language belong. A bin code usually carries one identifier for each sort, so a claim of a matching bin without naming the sort does not identify a part: two fixtures can hold identical flux bins and differ in colour, and identical colour bins and differ in electrical behaviour.
The Channels Inside a Multi-Channel Fixture
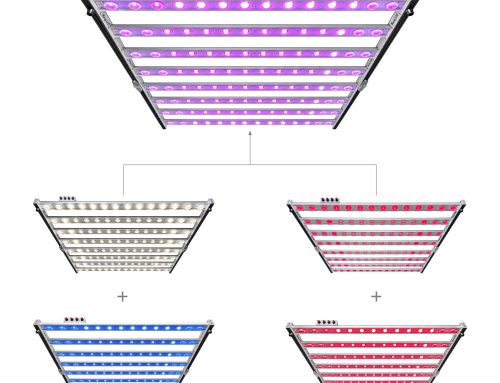
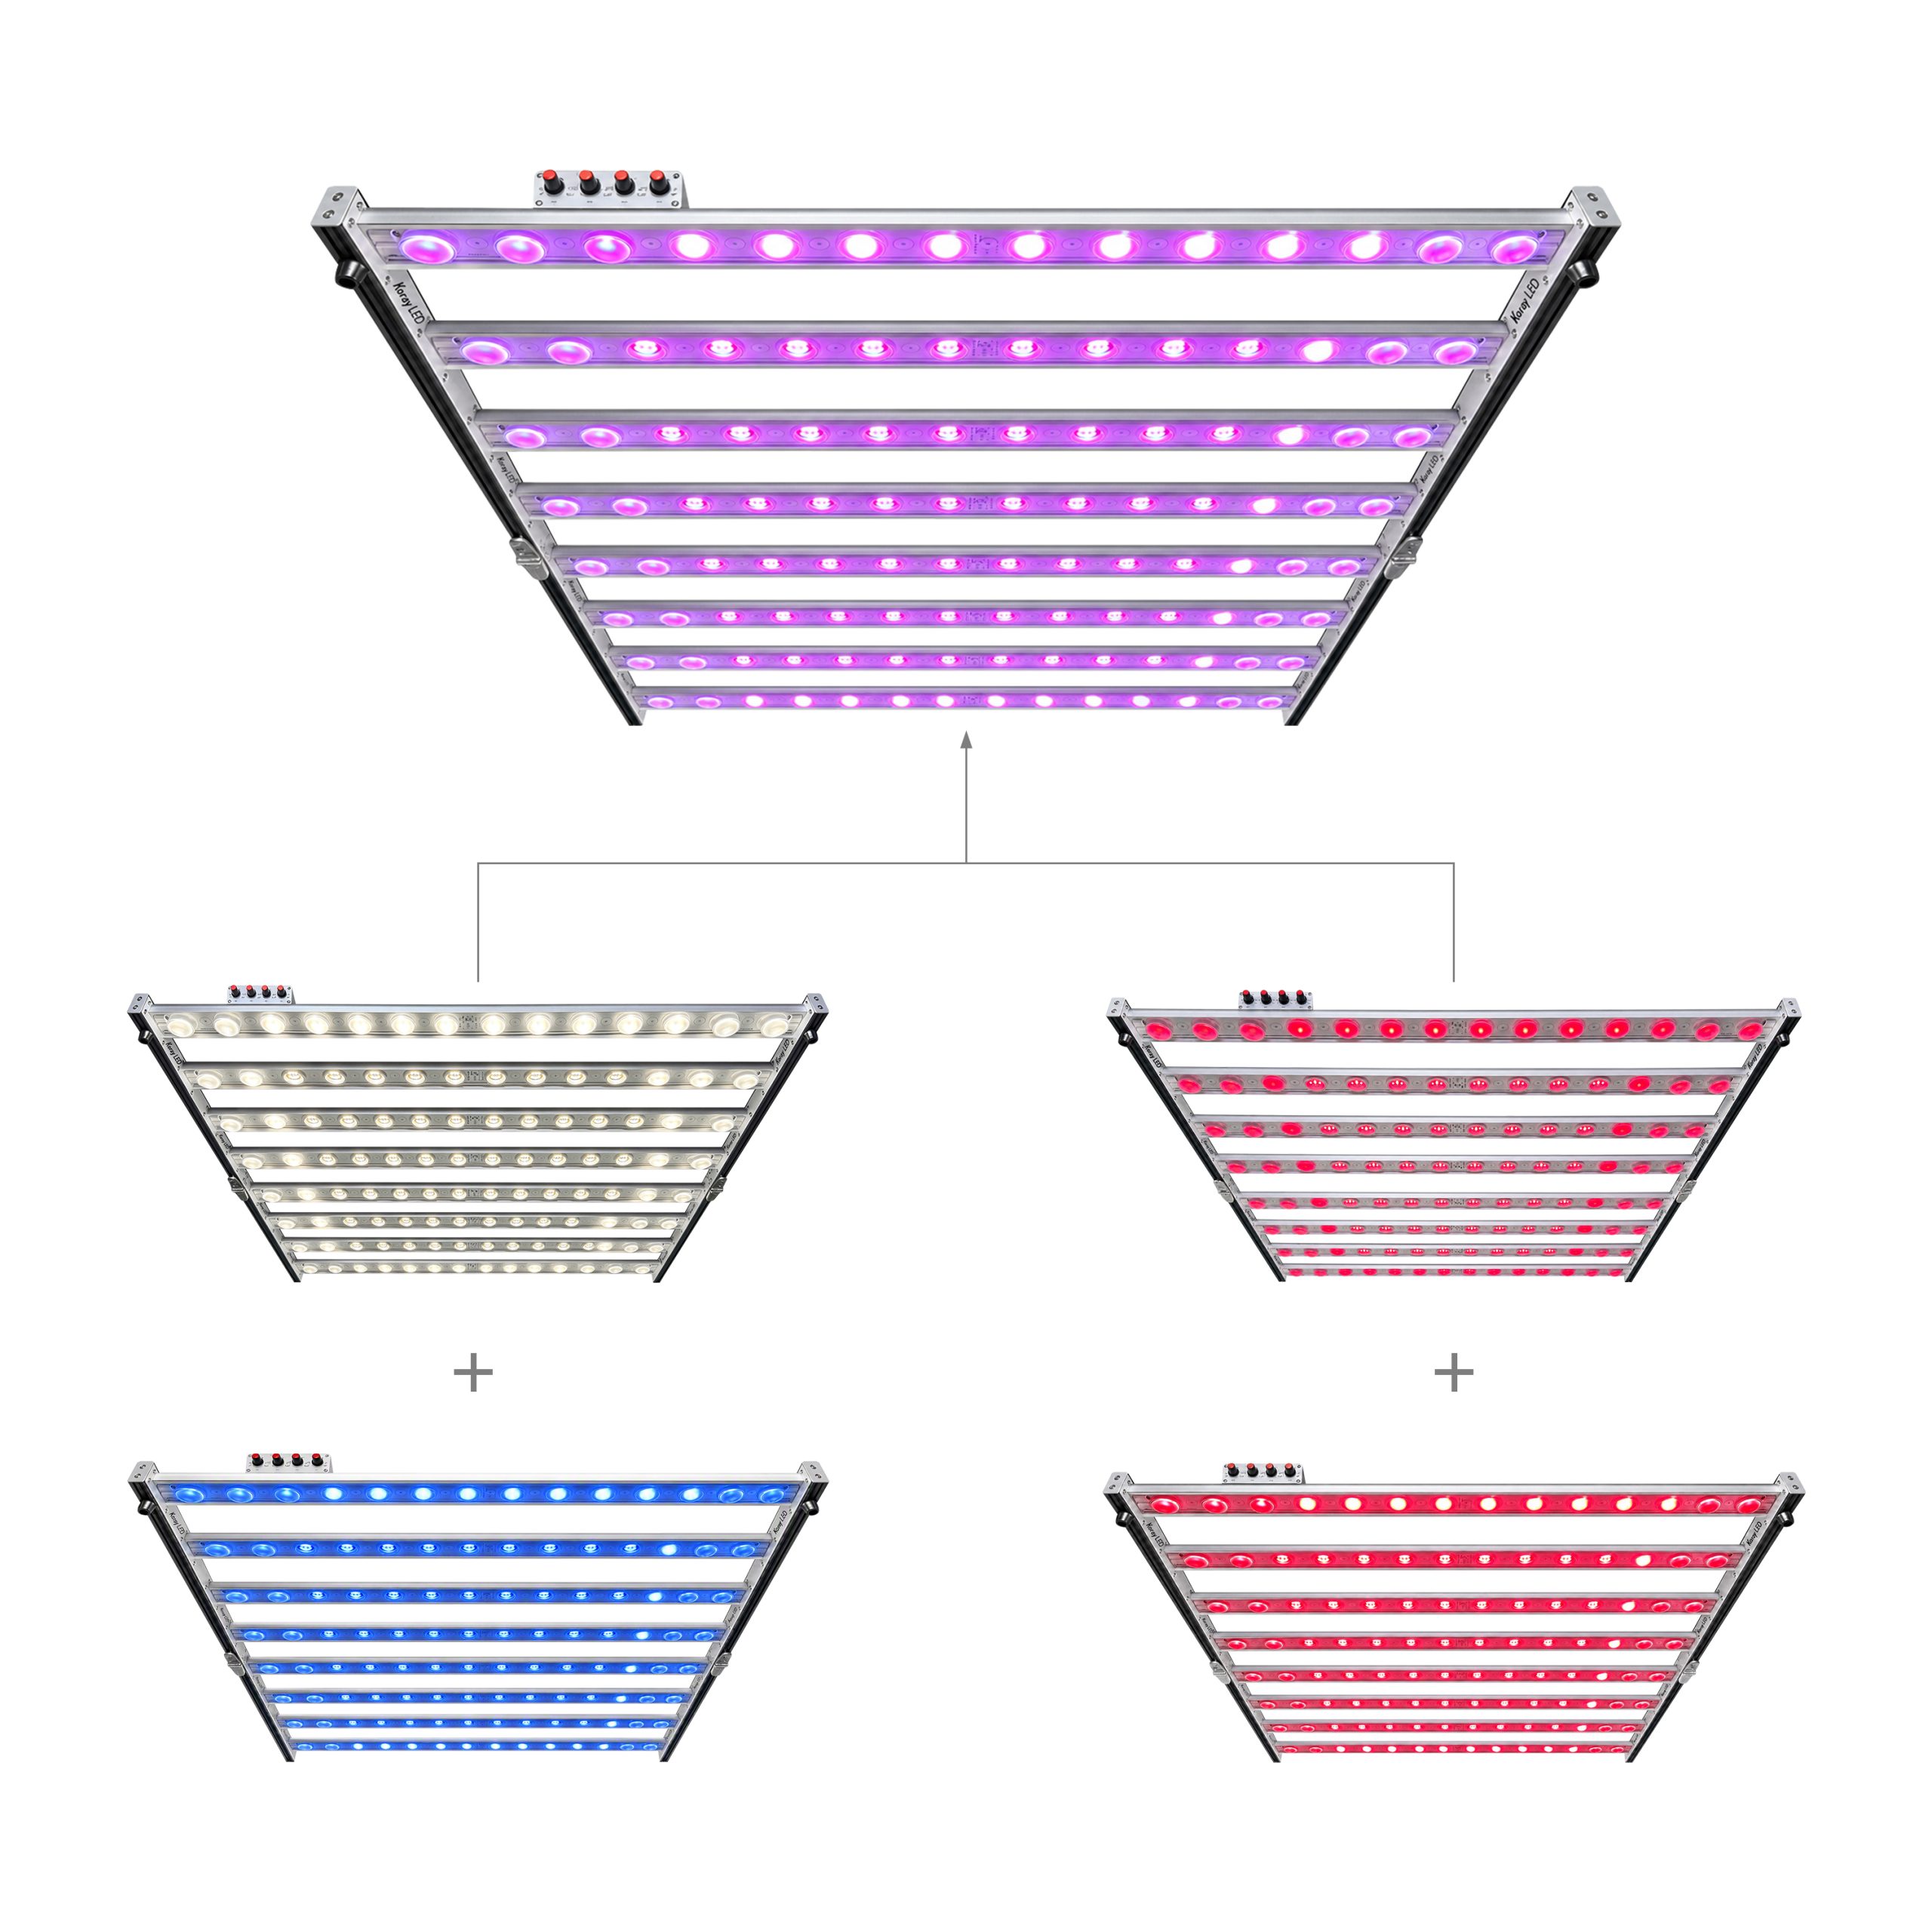
A multi-channel horticultural fixture splits the task of making light across several independently driven strings, each with its own spectral contribution. A common configuration separates a neutral white channel covering the broad visible band, a warm white channel with an added plant red contribution at 660 nm, a short-wavelength channel near 395 nm in the ultraviolet A band, and a far-red channel at 730 nm. Each channel has a different role and a different sensitivity to spread, which is why a single fixture-wide colour tolerance describes the product poorly.
| Channel | Waveband | Contribution to the mixed spectrum | Why its spread matters |
|---|---|---|---|
| CH1 | Neutral white, broad visible band | Sets the base of the mix and the general colour rendering | A shift here moves the whole mixed point across the diagram |
| CH2 | Warm white plus plant red 660 nm | Adds deep-red weighting for photosynthesis | Small weighting errors change the red content delivered to the canopy |
| CH3 | Ultraviolet A, 395 nm | Adds short-wavelength energy outside the visible range | Not visible, so a deviation cannot be judged by eye at all |
| CH4 | Far red, 730 nm | Adds a photomorphogenic signal in the far-red band | A small change in share can matter more than a large white-channel difference |
The mixed colour of a fixture is a weighted average of the chromaticities of its channels, with the weights set by how each channel is driven, and that arithmetic has a consequence that is easy to miss. When a recipe changes the share of two channels from a seventy-to-thirty split to an even split, the mixed point travels along the line between the two channel points and covers a span that can exceed the difference between a three-step and a five-step tolerance at a fixed ratio. By construction of the weighted mixture, tightening individual channel bins does not by itself guarantee a stable mixed colour. The two things that do are the tolerance of each channel and the stability of the ratio, and a specification naming only one of the two is incomplete.
The Canopy Consequence of a Drifting Mix Point
Uniformity work in controlled-environment rooms is usually reported as a PPFD map, and a PPFD figure is only meaningful together with the height at which it was measured and the daily photoperiod it assumes. A map quoted at a hanging height of 0.3 m above the canopy under an 18 hour photoperiod can be compared with another map only if both conditions travel with the numbers, because intensity falls with distance and the daily light integral accumulates with time. Two rooms can match on such a map and still differ in the spectrum that produced it, since flux uniformity and spectrum uniformity are different measurements.
That difference matters to the plant. The mixed spectrum sets the ratio of deep red to far red reaching a given point of the canopy, and phytochrome photoequilibrium responds to that ratio, which is the mechanism behind shade-avoidance responses such as extension growth and leaf expansion. A spectrum that is consistent from the centre of a room to its edge delivers a consistent signal, while a spectrum that drifts across the canopy delivers a different morphogenic signal to different leaves of the same plant. Colour consistency at the source is therefore an input to spatial uniformity rather than a cosmetic property, and the operational test is a spectral measurement at several points of the canopy rather than a single reading at the centre.
Conditions That Must Travel With a Colour Measurement
A bin limit is declared at a test condition. The chromaticity of an LED shifts with drive current, because current density changes the junction temperature and the emission spectrum, and it shifts again with ambient temperature and with the thermal path between the diode and its surroundings. A tolerance measured at a low current in a pulsed test does not transfer automatically to a fixture running at full current in a warm room, and that shift is a physical property of the device rather than a defect. Independent measurement research on the quality of light from solid-state sources is carried out at institutions such as the Lighting Research Center at Rensselaer Polytechnic Institute, whose published material documents how measurement conditions for solid-state lighting are handled (https://www.lrc.rpi.edu/).
The consequence is a rule about comparability. Because junction temperature, drive current and optical geometry all move the measured colour point, a tolerance has to be read together with the test current, the temperature and the instrument. Two suppliers can both state a three-step tolerance and still describe different behaviour, and where the conditions are absent the number cannot be reproduced by a third party, which makes it a marketing figure rather than a specification.
How to Verify a Colour Consistency Claim Before You Buy
Verification is a document request, and it is short enough to send in one message. Five items cover most of the exposure:
- The bin code and its definition: which quantity is sorted, what the tolerance is in step units, and at what drive current and temperature the tolerance was established.
- A test report from a laboratory able to state its instrument and its measurement geometry, so the numbers have a traceable origin.
- Sample-to-sample measurements of the finished mixed output, taken at two or more points of the intended dimming recipe rather than at one fixed setting.
- A spectral power distribution file for each recipe of interest, because a step count does not describe the shape of the spectrum.
- A statement of measurement uncertainty, since a tolerance narrower than the uncertainty of the measurement cannot be verified at all.
Requests framed this way tend to produce documents rather than adjectives. A supplier who answers with a bin definition and a test report has the data; a supplier who can only answer with a step count has a label.
Where Tight Colour Consistency Earns Its Cost
Tight tolerances cost money, because sorting dies into narrow groups discards more of a production run. The applications that justify the cost share one feature: several fixtures illuminate the same crop at the same time. Multi-tier propagation racks put many small fixtures over many small benches, and a spread between units shows up as a spread between benches. Trial rooms depend on light being a controlled variable rather than another source of variation. Large rooms where one recipe runs across dozens of fixtures reward per-channel tolerances, because the mixed point has to match at every panel rather than merely on average.
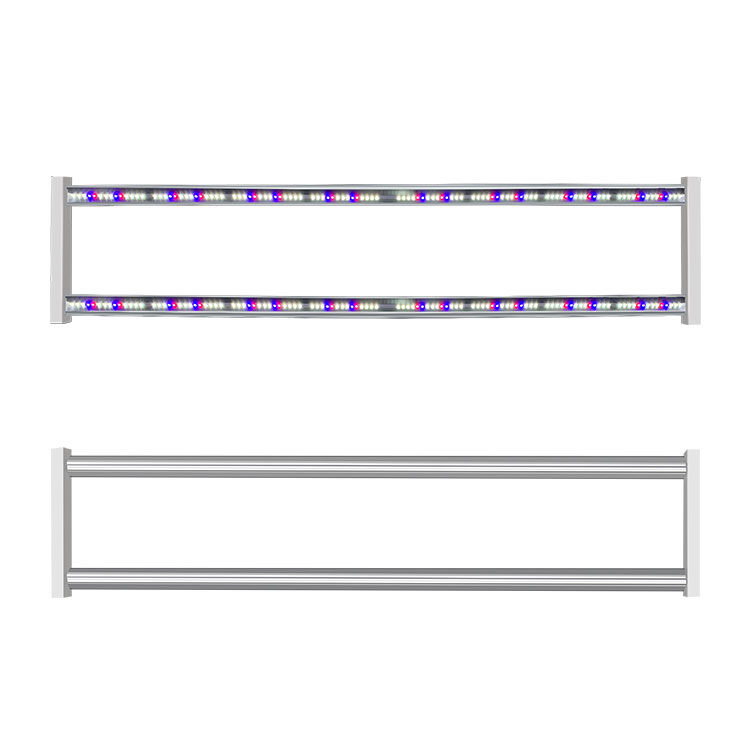
Rooms where people work under the light add a second, purely visual reason. A mixed spectrum assembled from a white channel, a deep-red addition and an ultraviolet channel renders colours differently from a single white source, and a large painted or planted surface makes a spread between adjacent fixtures easy to notice. Neither reason is a plant-response claim; both describe situations where the cost of tight sorting is recovered by removing a variable that would otherwise have to be measured and corrected after installation. Fixtures of this class are published by KorayLights (https://koraylights.com/), whose official page for the four-channel unit shown in the featured image lists the channel wavebands quoted above but no MacAdam step or SDCM value, which is exactly why the bin documentation has to be requested in writing.
What a Colour Tolerance Does Not Cover
A step count does not describe the spectral shape between the quoted wavelengths, so two sources inside the same three-step bin can still deliver different deep-red content to the canopy. It says nothing about flux matching, ageing, or mounting geometry, because a matched set of sources can still be installed so that one fixture sits closer to the crop than another. Each gap has its own document: a spectral power distribution measurement per recipe for spectral content, a PPF test report for flux matching, a maintenance programme with stated intervals for ageing, and a mapped measurement at a stated height and photoperiod for spatial uniformity. A colour tolerance is one line in that list, and its value is that it is the cheapest of those lines to verify before an order rather than after installation.
SDCM Bin Steps Compared
The table below compares the step counts that appear in horticultural quotations, read as tolerances in chromaticity coordinates at the stated test conditions.
| Bin tolerance | Chromaticity spread | What it buys in a multi-channel fixture | What it does not buy | Evidence to request |
|---|---|---|---|---|
| 1-step | About one standard deviation of colour matching | Near-identical channel points across units, at the limit of instrument resolution | Flux matching, spectral shape, ageing | Test report naming the instrument, current and temperature |
| 3-step | A narrow region, difficult to separate side by side | A consistent mixed point across many fixtures following one recipe | Stability when the recipe itself drifts between channels | Bin definition plus sample measurements at two recipe points |
| 5-step | The ordinary commercial compromise | A workable tolerance for rooms running a single dominant recipe | Edge-to-edge spectrum uniformity across a canopy | Spectral power distribution per recipe and a uniformity map |
| 7-step | A wide region, visible on large surfaces | Lower cost where several fixtures never share a canopy | Fitness for trial rooms and comparison chambers | A written justification for the wider tolerance |
| Not stated | Unknown, and not inferable from a description | Nothing verifiable | Everything, until documentation is produced | A written bin definition before an order is placed |
Conclusion
Colour consistency measures where a colour point sits, and in a multi-channel fixture that point is the result of a recipe as much as of a diode. The useful reading of a MacAdam step is therefore threefold: it is a tolerance in chromaticity coordinates, it applies to a part at a stated test condition, and it interacts with the channel ratios the control system applies. A buyer who requests the bin definition, the test conditions and the spectral measurement of the mixed output at more than one recipe point learns more about how a room will behave than any single step count can communicate.
Frequently asked questions
What is the difference between an SDCM step and a MacAdam ellipse?
A MacAdam ellipse is a region of the chromaticity diagram within which a standard observer cannot reliably distinguish a colour from the colour at its centre, and an SDCM step is the unit used to measure the radius of that region. One SDCM step equals one standard deviation of colour matching, so a three-step bin spans three such standard deviations around its centre point. The ellipse describes the local shape of the tolerance on the diagram, while the step count describes how wide the tolerance is in that unit.
Do tighter SDCM bins guarantee uniform colour across a canopy?
No. A tight chromaticity bin describes the spread of colour points between parts at a stated test condition, and it does not control flux matching, spectral shape between the quoted wavelengths, ageing, or the mounting geometry that decides how light is distributed. Canopy uniformity has to be established by a mapped measurement of the delivered light at a stated hanging height and a stated daily photoperiod, because uniformity is a property of the installation rather than of the diode batch.
Why does a multi-channel grow light drift in colour when the recipe changes?
The mixed colour of a multi-channel fixture is a weighted average of the chromaticities of its channels, and the weights are the drive ratios the control system applies. When the ratio between two channels changes, the mixed point moves along the line that joins those channel points, and the distance it travels can exceed the difference between two adjacent bin tolerances at a fixed ratio. The drift is therefore a property of the recipe rather than a defect in the diodes.
What documents should I request to verify a colour consistency claim?
Ask for the bin code with its definition and sorted quantity, a laboratory test report naming the instrument and the measurement geometry, sample-to-sample measurements of the mixed output at two or more recipe points, a spectral power distribution file for each recipe, and a statement of measurement uncertainty. Those five items allow an independent party to reproduce the claim, which a step count quoted on its own does not.
Does colour consistency affect plant growth or only how the light looks?
Both, and the mechanism differs. Mixed spectra that vary between fixtures deliver different deep-red to far-red ratios, and phytochrome photoequilibrium responds to that ratio, so a spectrum that varies across a canopy presents a varying morphogenic signal to different leaves of the same plant. Separately, a mixed spectrum assembled from several channels renders colours differently from a single white source, which changes how the room appears to the people working in it. The two effects are measured in different ways and neither substitutes for the other.






Leave A Comment