
Green light has a reputation problem that its physics does not support. Because leaves reflect it, growers sometimes read that reflection as proof that the 500–600 nm band is wasted on a crop. The measurement record says something different: leaves do absorb green, and the fraction that survives the first leaf layer is exactly what makes the band useful deeper inside a canopy.
This article approaches the band from two directions at once — where green photons end up inside a leaf, and where they end up inside a canopy — and then follows the metrology consequence that falls out of both. It does not rank spectra or propose a target percentage, because the official datasheets for the fixtures discussed here do not publish band fractions.
What 500–600 nm Means in a Grow-Light Spectrum
Green light is the 500–600 nm slice of the visible spectrum. Michigan State University Extension, in its publication Growing Plants with Green Light, treats the band as part of the photosynthetic spectrum rather than as a gap between blue and red, and places it inside the 400–700 nm waveband that defines photosynthetically active radiation.
A wavelength is a property of an individual photon: it sets how much energy that photon carries and how it interacts with a pigment molecule. A band is a range of wavelengths, not a verdict about usefulness. Those are different kinds of statement, and most of the confusion around green light comes from treating a band label as a quality judgment.
The practical consequence is that a 530 nm photon is a legal, countable PAR photon. It is not a degraded version of a 660 nm photon; it is a different photon with a different probability of being absorbed at a given depth.
Why Leaves Absorb Green Light Less Than Red or Blue
Chlorophyll a and chlorophyll b absorb most efficiently in the blue region around 430–450 nm and in the red region around 640–680 nm. In the green region between those two peaks, absorption per unit of path length through the leaf is lower, so a larger share of incident green is transmitted through the tissue and reflected from its surface. That lower absorption, plus strong reflection, is what produces the visual impression that green light bounces off a crop.
Lower absorption is not zero absorption. A whole leaf still removes a substantial share of the green light striking it — the band sits between two chlorophyll absorption peaks, not outside them. The claim that green light is photosynthetically inert is not supported by the measurement literature, and it does not survive a simple check: a leaf illuminated with green light alone still evolves oxygen.
Reading the colour of a leaf correctly. A leaf looks green because the light leaving it is dominated by reflected and transmitted wavelengths in the 500–600 nm range. Human colour perception integrates that outgoing light; it says nothing about the light that was absorbed on the way through. Reflection and absorption are two different fates for two different portions of the same incident beam.
This is why visual colour is a poor proxy for spectral performance. A dark green leaf can be absorbing a large fraction of incident green while still reflecting enough of it to read as saturated green to the eye.
Canopy Penetration: Where Green Photons Land
Inside a canopy, the relevant question changes. It is no longer “how much does one leaf absorb” but “how much light reaches the leaves below the first layer”. Those two questions have different answers, and the difference is where green light earns its place.
Because less green is removed per unit of leaf area, a green photon has a better chance of passing through the uppermost leaves and continuing downward. It also undergoes multiple scattering between leaves, so a portion of the light that initially passes through is redirected sideways and downward rather than lost. A peer-reviewed article indexed in PubMed Central (PMC11427831) reports that green light penetrates deeper into the canopy than red or blue light and produces a more uniform vertical light distribution, with whole-plant photosynthesis able to increase even when top-of-canopy PPFD is unchanged.
That last clause deserves emphasis. Top-of-canopy PPFD is a surface measurement taken at one plane. Whole-plant carbon gain depends on the light reaching every leaf layer, including the ones shaded by the layer above. A spectrum that concentrates its energy in strongly absorbed bands can produce an impressive surface reading while leaving the lower third of the canopy in near darkness.
Why scattering matters more than absorbance alone. Multiple scattering is the mechanism that turns a modest absorption advantage into a distribution advantage. Red and blue photons are removed quickly at the top of the canopy, so the light profile falls steeply with depth. Green photons are removed more slowly and are re-emitted in new directions at each leaf encounter, which flattens the profile. The same total photon flux, delivered with a flatter vertical profile, reaches a larger total leaf area.
The Metrology Trap: PPFD Counts Green at Full Weight
PPFD is photosynthetic photon flux density: the number of photons in the 400–700 nm band arriving per square metre per second, expressed in µmol·m⁻²·s⁻¹. The definition integrates every photon in that band with equal weight. There is no green discount, no spectral correction factor, and no colour-dependent multiplier in the unit.
A green photon therefore counts exactly as much as a red photon in a PPFD figure. If a spectrum were to place one photon in five in the 500–600 nm band, those photons would contribute one fifth of the reported PPFD. This is a counting rule, not a claim about photosynthetic efficiency per photon; the two are commonly conflated in marketing language and should be kept separate.
Daily light integral follows from the same count:
DLI (mol·m⁻²·d⁻¹) = PPFD (µmol·m⁻²·s⁻¹) × 3600 × photoperiod (h) ÷ 1,000,000
For example, a canopy receiving 400 µmol·m⁻²·s⁻¹ over an 18-hour photoperiod accumulates 400 × 3600 × 18 ÷ 1,000,000 = 25.9 mol·m⁻²·d⁻¹. That arithmetic holds regardless of spectrum. What it cannot tell you is how those moles were distributed through the canopy — a limitation worth remembering whenever two fixtures are compared on PPFD alone.
How Green Interacts With Blue- and UV-Mediated Responses
Green light is not a neutral filler in a spectrum. Michigan State University Extension notes that green can antagonise some responses mediated by blue and UV light, acting through the interaction between cryptochrome and phytochrome signalling. In plain terms: adding green can partially offset a blue-driven morphological response rather than simply adding photosynthesis on top of it.
The direction of that interaction is well described; the dose at which it becomes agronomically significant is species- and condition-dependent, and this article does not attach numbers to it. The operational point is narrower and more useful: a green channel changes both the light budget and the signalling environment, so it should be specified deliberately rather than treated as ballast.
Comparing 500–600 nm With Adjacent Bands
The table below compares the green band with the blue and red regions on the dimensions that actually decide how a spectrum behaves inside a crop. “Not specified in the official datasheet” means the manufacturer of the fixtures discussed does not publish that figure, and no estimate is substituted here.
| Dimension | 400–499 nm (blue) | 500–600 nm (green) | 600–700 nm (red) |
|---|---|---|---|
| Leaf absorption tendency | High — near the chlorophyll peak at 430–450 nm | Lower per unit path length; a substantial share is still absorbed | High — near the chlorophyll peak at 640–680 nm |
| Canopy penetration | Shallow; removed quickly in the upper layers | Deepest of the three, with strong multiple scattering | Shallow to moderate; absorbed strongly at the top |
| Counted in PPFD | Yes, 1:1 per photon | Yes, 1:1 per photon | Yes, 1:1 per photon |
| Effect on vertical light uniformity | Steep fall-off with depth | Flatter profile, more uniform distribution | Steep fall-off with depth |
| Value in visual crop inspection | Poor colour rendering; canopy looks dim | Good colour rendering; useful for scouting and pest checks | Poor colour rendering; red-biased appearance |
| Band share published in official datasheets | Not specified in the official datasheet | Not specified in the official datasheet | Not specified in the official datasheet |
Fit for Your Site
Koray has manufactured LED grow lights for 17 years, and the practical lesson from that production history is unglamorous: the band that gets argued about most is rarely the band that decides a crop outcome on its own. What decides outcomes is the combination of spectrum, mounting height and the vertical light profile that results from both.
Three recommendations follow from the physics above, and none of them requires accepting a band percentage from a supplier:
- Measure below the surface. Take PPFD readings at the top of the canopy and again 30 cm and 60 cm lower, at the same mounting height you intend to run. A single top-of-canopy reading cannot distinguish a steep profile from a flat one.
- Ask for the spectral power distribution file. A relative SPD curve lets you see where the green energy actually sits. Band fractions that are not published in the official datasheet should not be inferred from a marketing graphic.
- Treat a green channel as a specification, not a bonus. If a fixture offers independent channel control, the green channel’s purpose — deeper penetration, better visual inspection, or offsetting a blue response — should be written down before the crop is planted.
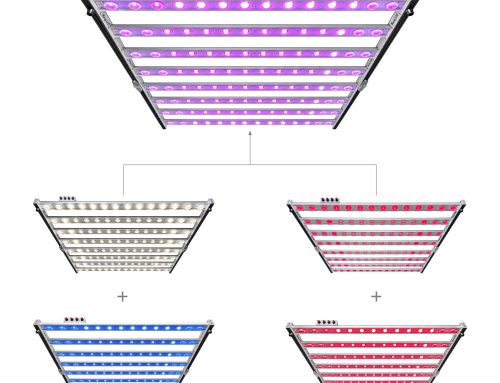
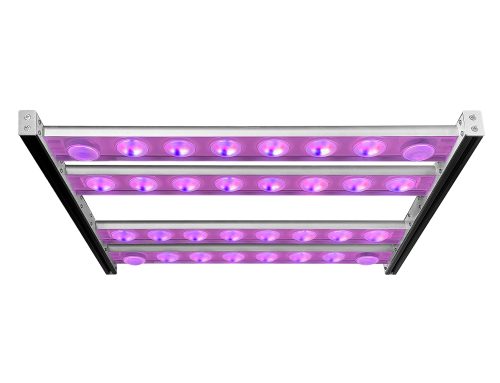
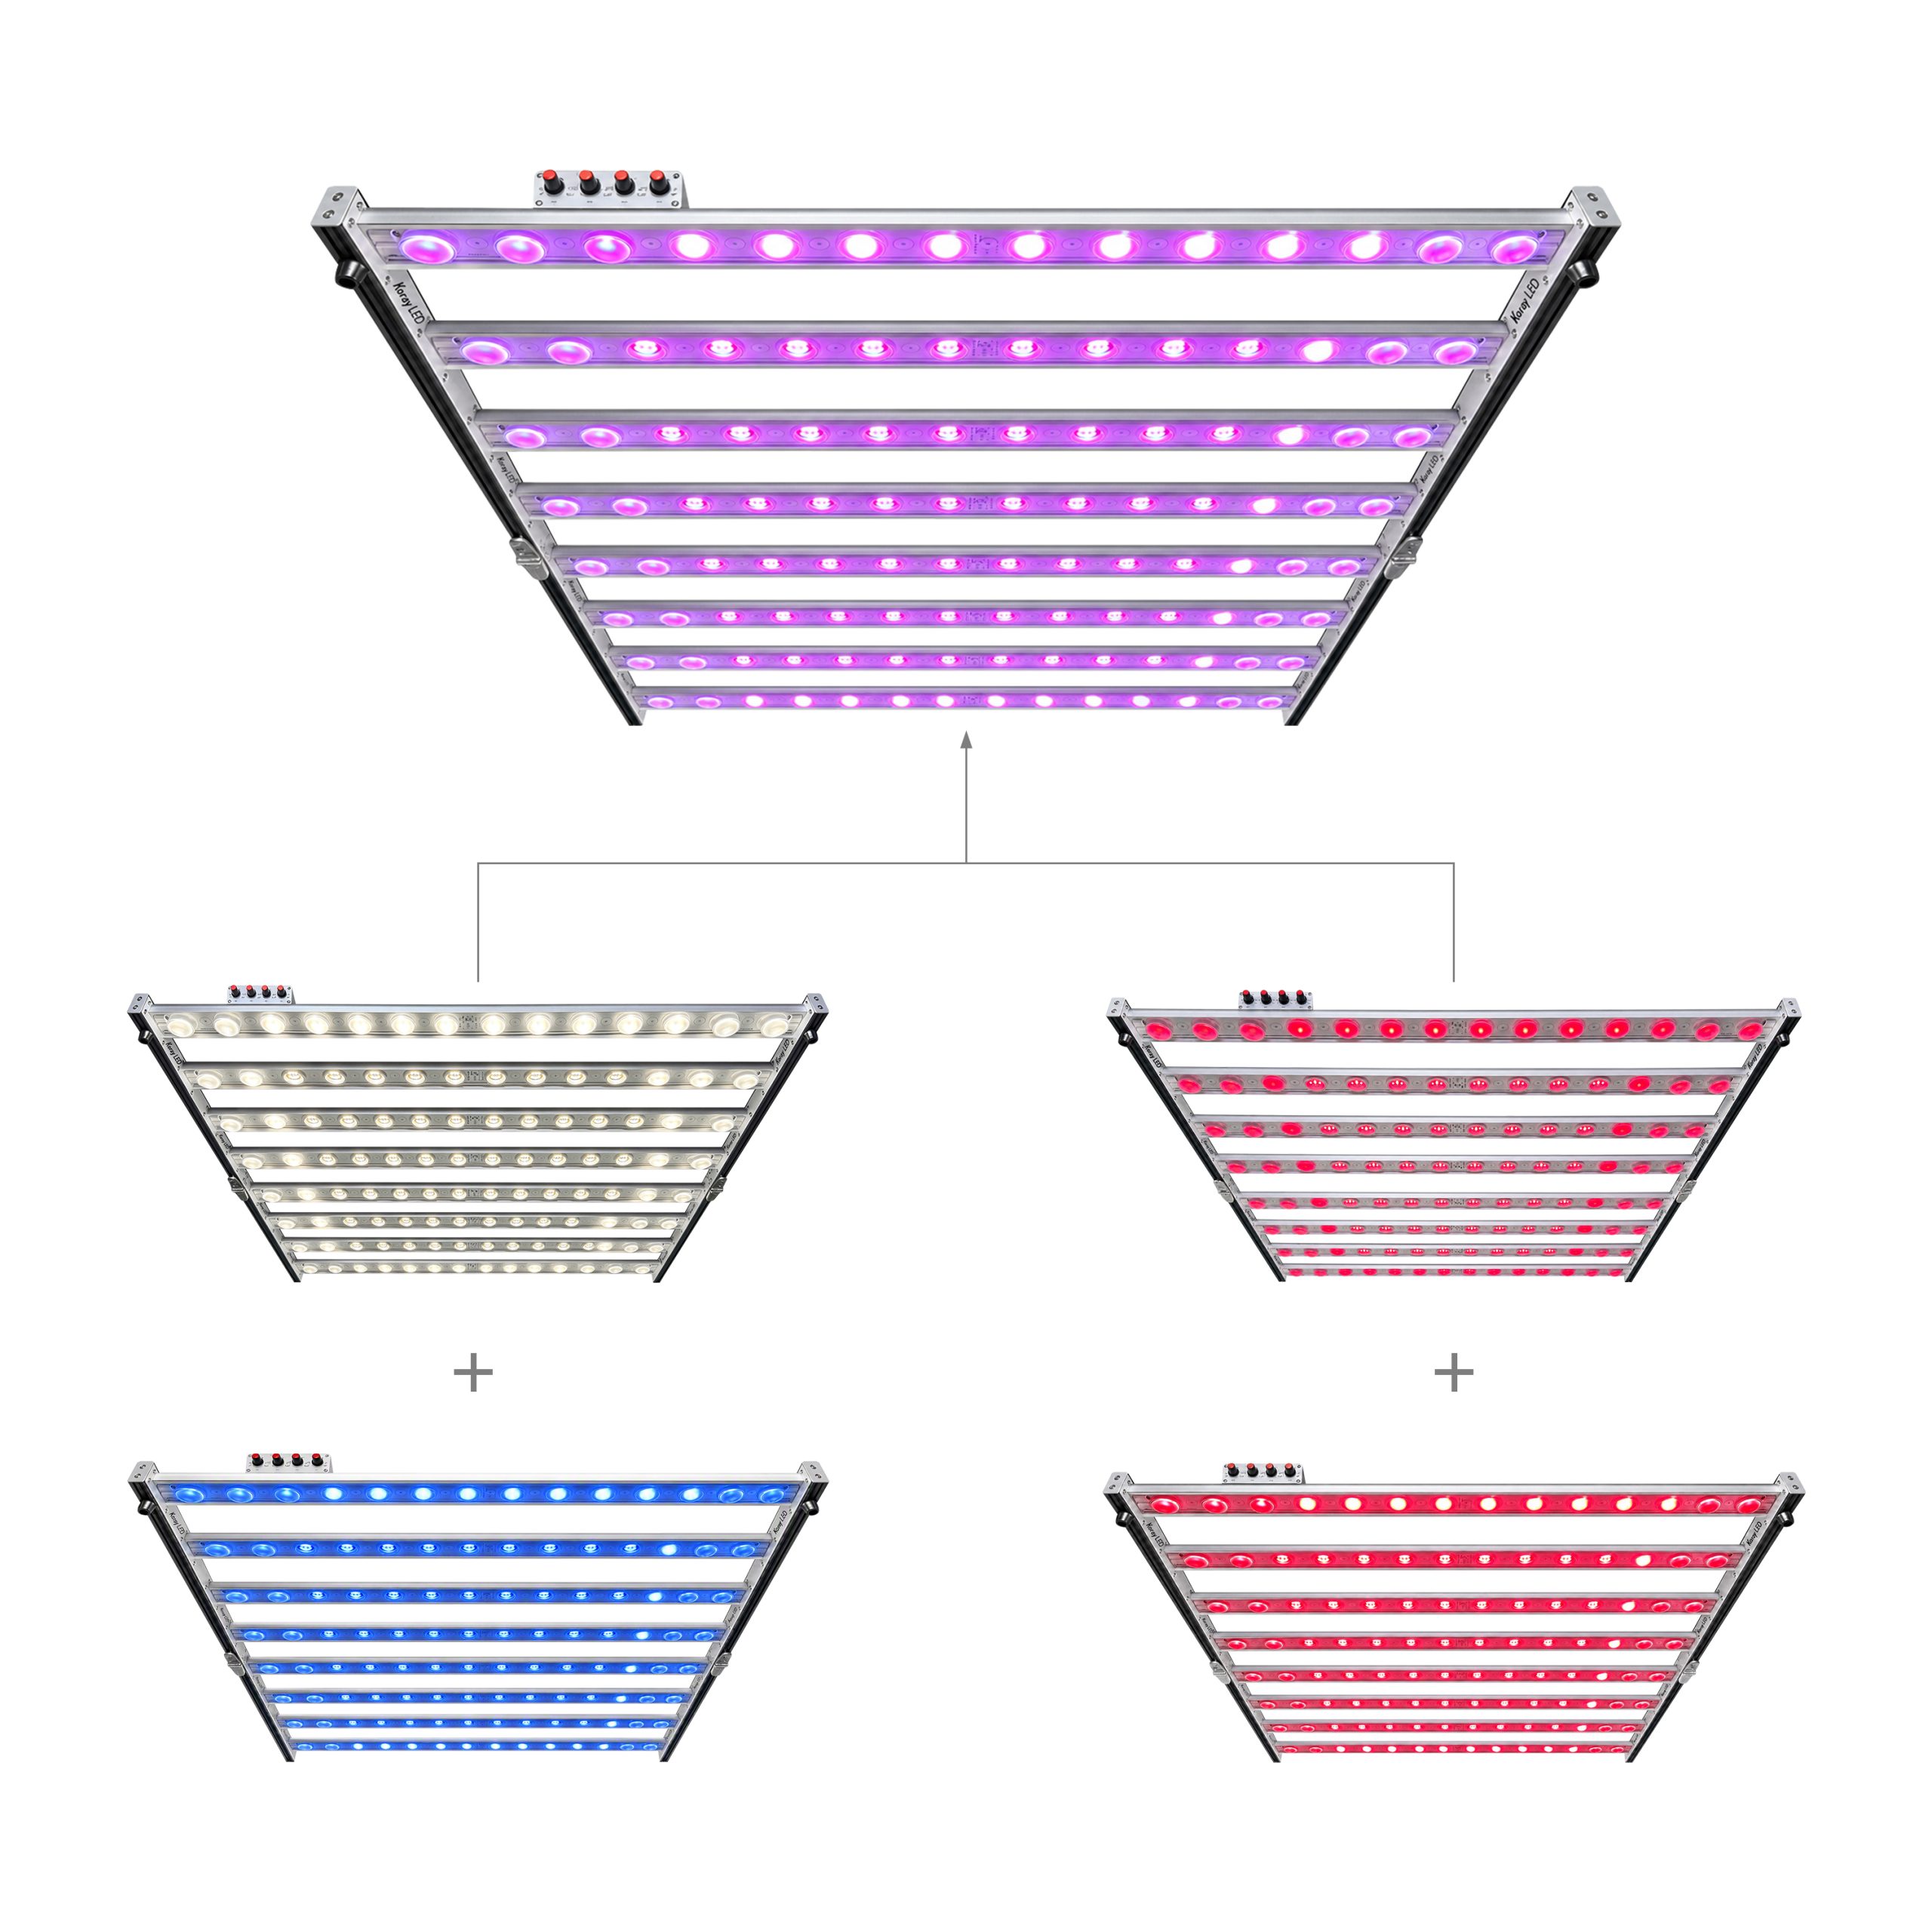
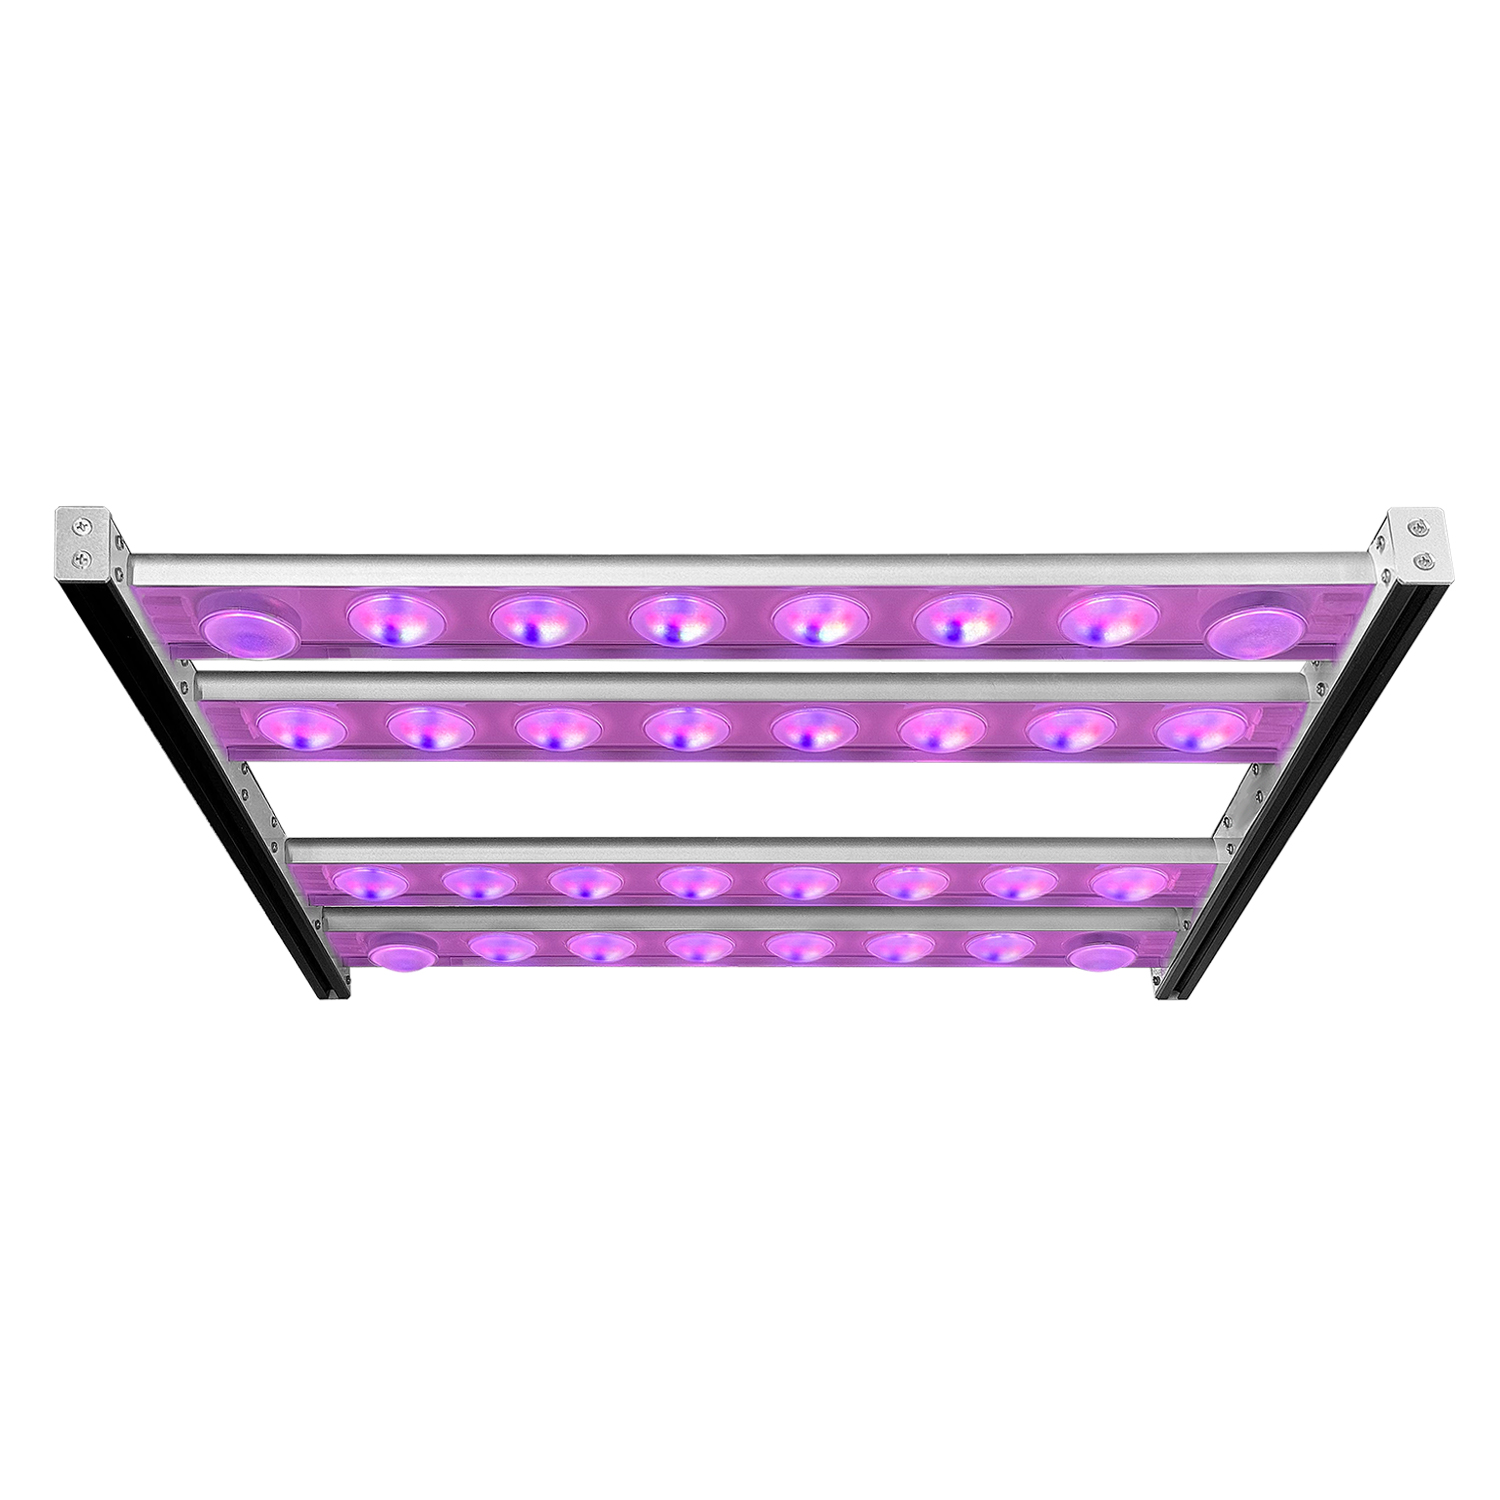
Fixtures with adjustable spectrum and independent channel control, such as the ARZ-G45 bar series, make those choices available; they do not make the choices for you, and the official datasheet does not state a green-band percentage for them.
FAQ
Does green light count toward PPFD and DLI?
Yes. PPFD is defined over the 400–700 nm band and weights every photon in that band equally, so green photons at 500–600 nm are counted one for one. Because DLI is derived from PPFD by DLI = PPFD × 3600 × photoperiod ÷ 1,000,000, green light contributes to DLI in exactly the same proportion.
Why do leaves look green if they still absorb green light?
Because appearance is set by the light that leaves the leaf, not the light that stays inside it. Chlorophyll absorbs green less efficiently than blue or red, so a larger share of incident green is reflected and transmitted — and that outgoing light, integrated by the eye, produces the green appearance. Absorption is lower in that band, not absent.
Does green light really reach deeper into a canopy than red or blue?
Yes, according to the peer-reviewed work indexed as PMC11427831, which reports deeper penetration and a more uniform vertical distribution for green light compared with red or blue. The mechanism is a combination of lower absorption per leaf layer and multiple scattering, which redirects surviving photons sideways and downward instead of losing them at the top.
Can a red-and-blue-only fixture be judged by PPFD alone?
No. PPFD counts photons arriving at a plane; it does not describe where those photons end up inside the canopy. A red-and-blue fixture can post a high top-of-canopy PPFD and still deliver a steep vertical gradient. Canopy distribution has to be measured separately, at more than one height, before the spectrum can be judged.
Conclusion
Green light is neither a loophole nor a liability. At 500–600 nm it is counted in full by every PAR meter, absorbed less efficiently per leaf layer than blue or red, and therefore able to travel further into a canopy and flatten the vertical light profile — a distribution effect that a top-of-canopy PPFD reading cannot reveal. The remaining question for any grower is not whether green “works”, but whether the fixture in front of them lets the vertical profile be measured rather than assumed.




Leave A Comment